Browsing Tag
Falling Wedge
226 messages
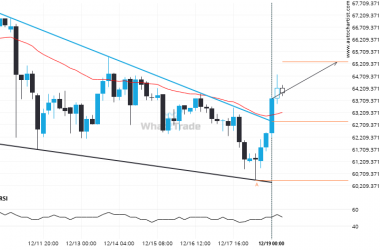
Breach of resistance could mean a start of a bullish trend on BTCAUD
Falling Wedge pattern identified on BTCAUD has broken through a resistance level with the price momentum continuing to…
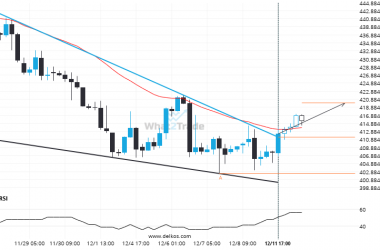
There is a possibility of a big movement on Soybean Meal January 2024 after a breach of the resistance
Soybean Meal January 2024 has broken through a resistance line of a Falling Wedge chart pattern. If this…
GBP/USD has broken out from the Falling Wedge pattern. Expect it to hit 1.2612 soon.
GBP/USD has broken through a resistance line of a Falling Wedge chart pattern. If this breakout holds true,…
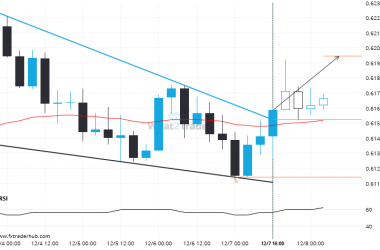
Resistance line breached by NZD/USD. This price has been tested at least twice before.
NZD/USD has broken through a resistance line of a Falling Wedge and suggests a possible movement to 0.6196…
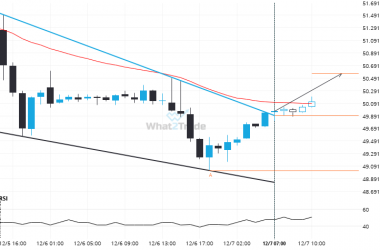
A possible move by Soybean Oil January 2024 towards 50.5636
Soybean Oil January 2024 has broken through a resistance line of a Falling Wedge chart pattern. If this…
A possible move by Soybean Oil January 2024 towards 50.5636
Soybean Oil January 2024 has broken through a resistance line of a Falling Wedge chart pattern. If this…
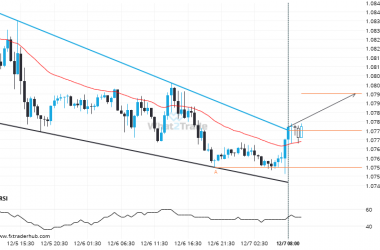
EUR/USD broke through a resistance at 2023-12-07T09:30:00.000Z, with the price momentum continuing to move in an upward direction over the next hours, good opportunity presents itself with the price expected to reach 1.0799.
This trade steup on EUR/USD is formed by a period of consolidation; a period in which the price…
After testing resistance twice in the past, USD/JPY has finally broken through. Can we expect a bullish trend to follow?
USD/JPY has broken through the resistance line which it has tested twice in the past. We have seen…
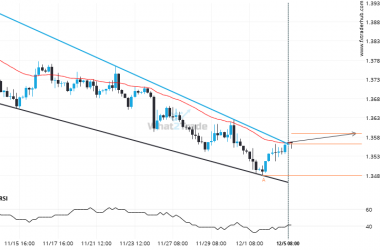
USD/CAD broke through a resistance at 2023-12-05T06:00:00.000Z, with the price momentum continuing to move in an upward direction over the next hours, good opportunity presents itself with the price expected to reach 1.3589.
USD/CAD has broken through a resistance line of a Falling Wedge chart pattern. If this breakout holds true,…
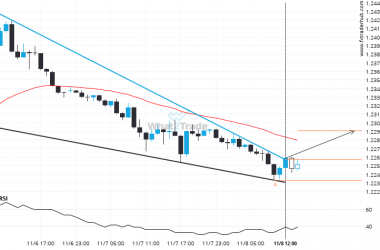
Bulls aim for 1.2300 after the GBP/USD triggered a bullish formation on the 1 hour chart
GBP/USD has broken through the resistance line which it has tested twice in the past. We have seen…


