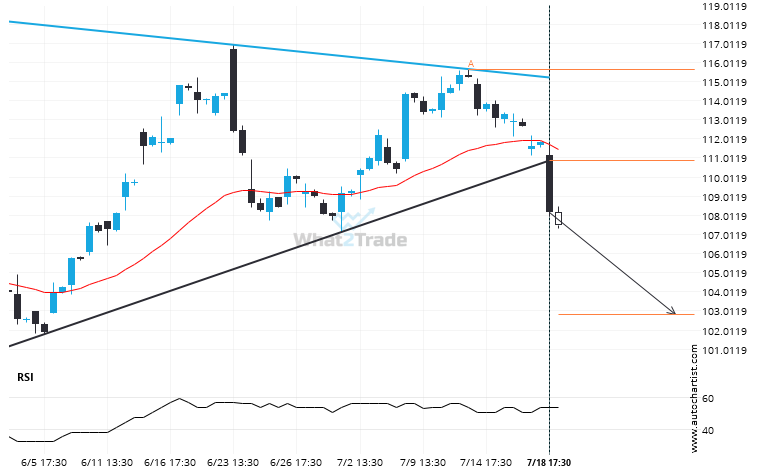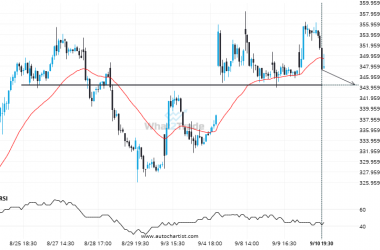
XOM has broken through a support line of a Triangle and suggests a possible movement to 102.8407 within the next 3 days. It has tested this line in the past, so one should probably wait for a confirmation of this breakout before taking action. If the breakout doesn’t confirm, we could see a retracement back to lines seen in the last 68 days.
Support line breached by XOM. This price has been tested at least twice before.