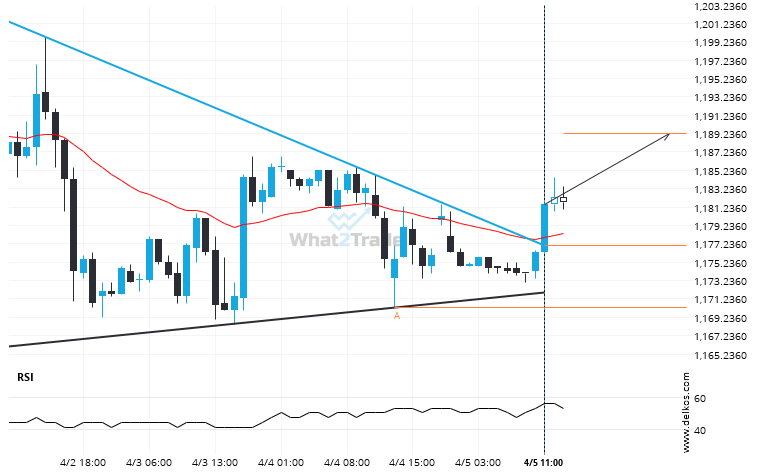
Soybeans May 2024 has broken through the resistance line of a Triangle technical chart pattern. Because we have seen it retrace from this line in the past, one should wait for confirmation of the breakout before taking any action. It has touched this line twice in the last 4 days and suggests a possible target level to be around 1189.2221 within the next 15 hours.
Related Posts
Brent Crude formed a Falling Wedge on the 1 hour chart. Retest of support in sight.
Emerging Falling Wedge detected on Brent Crude – the pattern is an emerging one and has not yet…
Breach of support could mean a start of a bearish trend on Silver Spot
This trade setup on Silver Spot is formed by a period of consolidation; a period in which the…
Gold Spot seems to be on its way to resistance – a possible opportunity?
Gold Spot is approaching a resistance line at 3871.7600. If it hits the resistance line, it may break…

