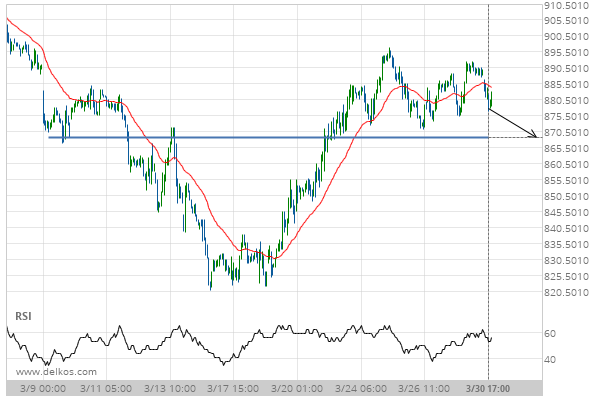
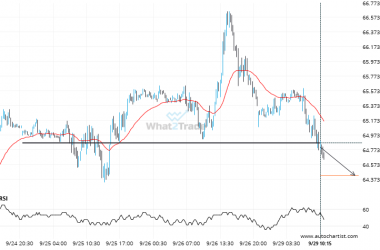
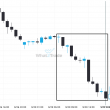
Soybeans MAY 2020 is approaching the support line of a Support. It has touched this line numerous times in the last 22 days. If it tests this line again, it should do so in the next 4 days.
Related Posts
US Oil – Large moves like this tend to draw attention.
An unexpected large move occurred on US Oil 1 hour chart, starting at 65.5195 and reaching 63.2685. It…
Breach of 64.8690 could mean a start of a bearish trend on US Oil
US Oil has broken through 64.8690 which it has tested numerous times in the past. We have seen…
Gold Spot is signaling a possible trend reversal on the intraday charts with price not breaching support.
Gold Spot is trapped in a Rising Wedge formation, implying that a breakout is Imminent. This is a…