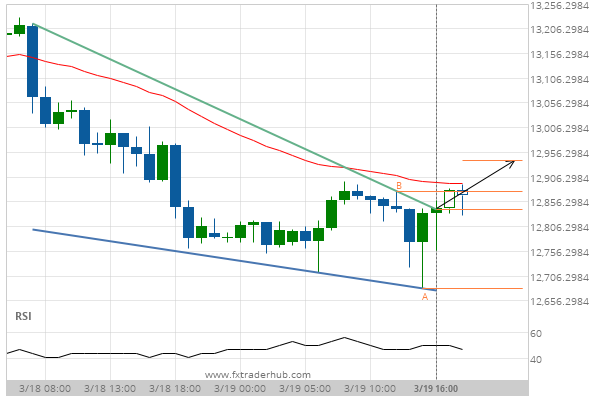
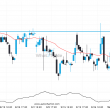
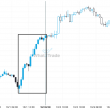
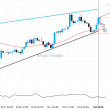
NAS100 has broken through the resistance line which it has tested twice in the past. We have seen it retrace from this position before, so one should wait for confirmation of the breakout before trading. If this new trend persists, a target line of around 12941.1168 can be expected within the next 7 hours.
Related Posts
FTSE 100 – approaching a price line that has been previously tested numerous times in the past
A strong resistance level has been identified at 8791.5195 on the 15 Minutes FTSE 100 chart. FTSE 100…
DOW 30 is quickly approaching the support line of a Descending Triangle. We expect either a breakout through this line or a rebound.
DOW 30 is moving towards a support line. Because we have seen it retrace from this line before,…
After testing the resistance line numerous times, ASX 200 is once again approaching this line. Can we expect a bullish trend to follow?
Emerging Triangle detected on ASX 200 – the pattern is an emerging one and has not yet broken…