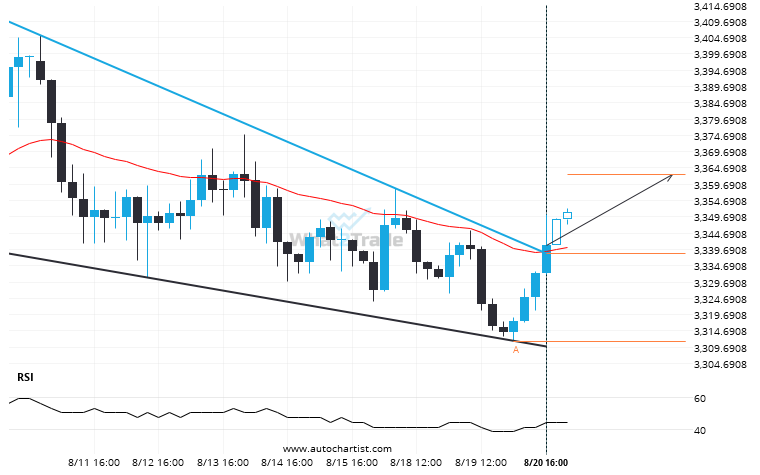
The last 21 4 hour candles on Gold Spot formed a Falling Wedge pattern and broken out through the pattern lines, indicating a possible bullish movement towards the price level of 3362.7927.
Resistance line breached by Gold Spot. This price has been tested at least twice before.