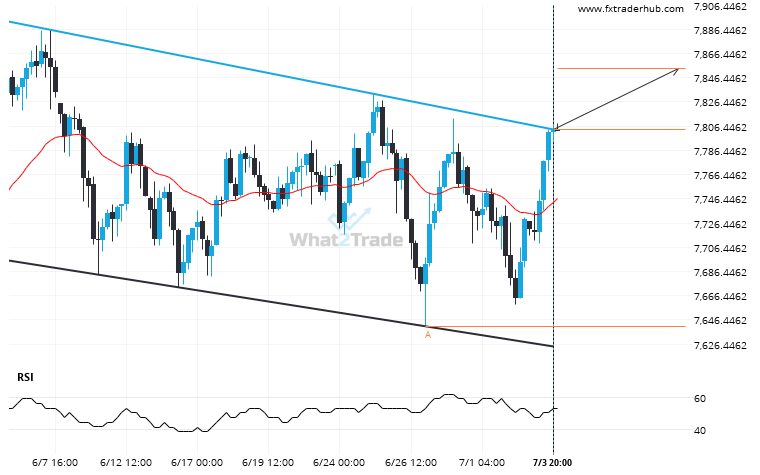
You would be well advised to confirm the breakout that has just occurred – do you believe the move through resistance to be significant? Do you have confirming indicators that the price momentum will continue? If so, look for a target of 7854.1896 but consider reducing the size of your position as the price gets closer to that target.
Related Posts
Nikkei 225 – approaching a resistance line that has been previously tested at least twice in the past
An emerging Falling Wedge has been detected on Nikkei 225 on the 4 hour chart. There is a…
A final push possible on US 500 as it starts approaching a price line of 6483.2598.
The movement of US 500 towards 6483.2598 price line is yet another test of the line it reached…
After testing the support line numerous times, FTSE 100 is once again approaching this line. Can we expect a bearish trend to follow?
The movement of FTSE 100 towards the support line of a Channel Up is yet another test of…