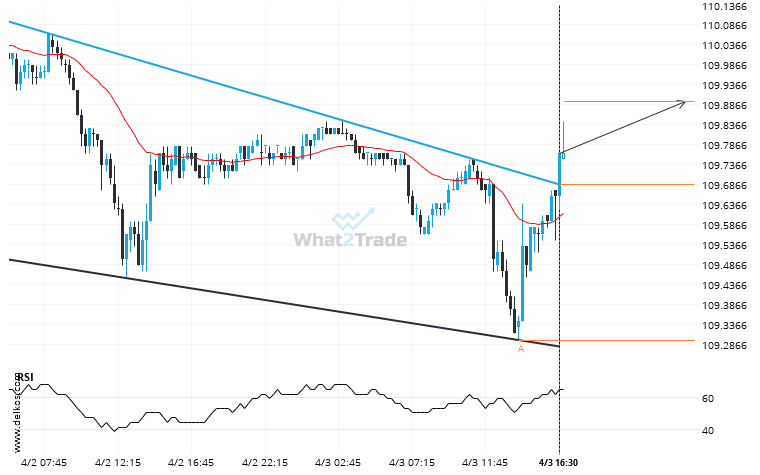
10 Yr Us Treasury Note June 2024 moved through the resistance line of a Falling Wedge at 109.686286407767 on the 15 Minutes chart. This line has been tested a number of times in the past and this breakout could mean an upcoming change from the current trend. It may continue in its current direction toward 109.8950.
Related Posts
Because Gold Spot formed a Channel Up pattern, we expect it to touch the support line. If it breaks through support it may move much lower
Gold Spot is moving towards a support line. Because we have seen it retrace from this line before,…
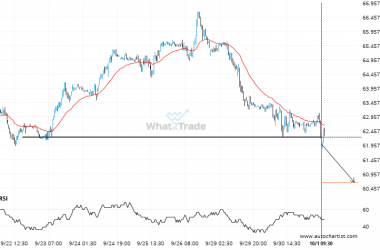
US Oil is currently testing a level of 62.2340. Will the breakout continue or will things reverse?
US Oil has broken through 62.2340 which it has tested numerous times in the past. We have seen…
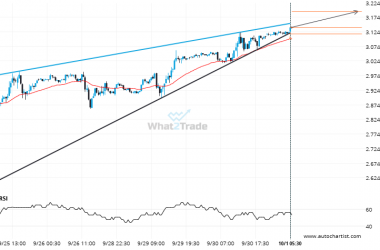
A Rising Wedge has formed, Natural Gas is approaching support. Can we expect a breakout and the start of a new trend or a reversal?
Natural Gas was identified at around 3.1395 having recently rebounded of the support on the 30 Minutes data…

