Oscillators, one of the most interesting groupings of technical indicators, are designed to signal overbought and oversold levels. Oscillators are a family of indices that go beyond the mathematics. They focus on one important thing and that is momentum, or more specifically changing momentum. Before we delve into which Oscillators are best to use and how, let me save you some unnecessary pain. Let me tell you first what oscillators aren’t.
How Not to use Oscillators
Some traders believe that Oscillators are some sort of magic indexes. Rest assured when I tell you they are not. Oscillators’ main use is not to tell you whether to buy or sell. Rather, they alert you to when it might be a good time to execute a buy or sell strategy. That is a very big difference. Those who attempt to use Oscillators as an ultimate buy or sell signal should be ready to learn a tough lesson. Those that will use it to fine tune their timing, however, will find Oscillators a very powerful tool.
Now that we’ve established what oscillators are good for let’s focus on which oscillators are worth your time and how to use them.
MACD Indicator
Perhaps the most widely used Oscillator in Forex, the MACD needs no special introduction. What it does need is a proper explanation of how to use it and when.
The idea of MACD is to signal your entry point when you’ve already figured out where the trend is going. It’s not going to alert you to a trend. What that means is that you first have to perform your technical analysis. Once you reach a conclusion, then you can use the MACD.
On MT4, the MACD comes with default parameters (12, 26, 9). 12 represents the fast Exponential moving average, 26 the slow exponential moving average and 9 the Simple MACD average. Usually, when you trade on a daily basis, those parameters are fine.
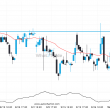
Now in the chart below we see two points, A and B. In point A, the histogram moved above the average and that is supposed to be a buy signal. But, technical common sense says that a pronged bearish trend cannot end abruptly without some form of double bottom. Hence, one should ignore that signal.
But in point B, that’s a different story. After a double top that hits a resistance level and hits the trend average, there’s a case for a short. But we need to know when. Notice how after the second top the histogram in the MACD falls again below the average? That’s our mark and that is how you use MACD to time your trade. Once again, the lesson here is that Oscillators are for timing, not for point to the pair’s direction.
Stochastic Oscillator
This is one of the most interesting indicators in the Oscillators family. What I like about this indicator is that it essentially gives you a 2-dimensional picture of overbought, oversold and momentum. Unlike the MACD, that’s not always accurate on overbought/oversold level.
The idea of the stochastic oscillator is twofold. First, it’s normalized from 0 to 100, anything below 20 is oversold and anything above 80 is overbought.
Second, using the convergence between the %K line and the %D line tells you something. Not only can you tell when there is an overbought/oversold level but also when the trend turns bullish or bearish. Thus it affords a 2-dimensional use of momentum. Confused? Here’s a classic example of how I would use a stochastic oscillator.
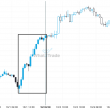
In the first part, we can see that in point C, after the pair has bottomed, the stochastic oscillator was below 20. That signaled an oversold level. We can conclude that there the pair is bottomed out, through a double bottom pattern. We can use the oversold level as enforcement but wait before dipping our toes into a buy position. Only in point D, as the blue line crosses the red line, we get our signal for entry.
However, one other thing is important to note and that is point E. In point E we get the blue line crossing the red line as it does with C. However, since the cross occurs very close to the overbought signal that should deter us from establishing it as an entry. Which means if the crossing in point D was close to the stochastic 80 level, we should have avoided entry.
Average True Range
Last but not least, one of my favorite indicators, the Average True Range or ATR for short. Unlike the other two Oscillators the ATR is useful in anticipating potential rises or falls in volatility. Also unlike the other two, there is no oversold or overbought levels. If the ATR is high it suggests volatility is high. Conversely, if the ATR is low it suggests volatility is low.
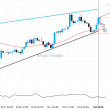
How can we use this to predict volatility? We know, of course, that volatility is cyclical. Thus we can assume that when the ATR is at record lows for a prolonged period (point F) it’s a signal that a spike in volatility is coming. And, indeed, we can see volatility did come and we got the big spike.
If we decide to use the support as an entry signal we can ATR to gauge whether there’s a chance our buy trade will have a strong momentum. If the ATR was at a record high when we decide to buy that would have been a cautionary note. Not to entry but because it signals that volatility might fall and that means momentum might have been weak. The same principle, of course, works for a sell signal.

