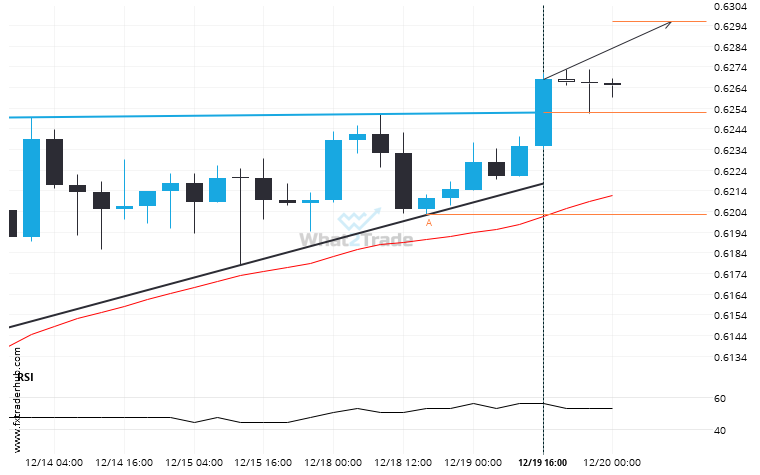
NZD/USD has broken through a resistance line of a Ascending Triangle chart pattern. If this breakout holds true, we may see the price of NZD/USD testing 0.6296 within the next 16 hours. But don’t be so quick to trade, it has tested this line in the past, so you should confirm the breakout before taking any action.
Related Posts
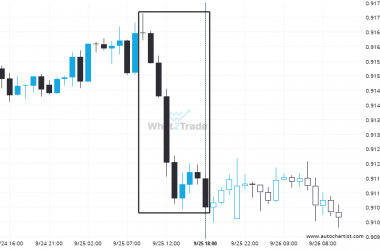
AUDCAD experienced a very large 9 hours bearish move to 0.91067.
AUDCAD has moved lower by 0.65% from 0.91662 to 0.91067 in the last 9 hours.
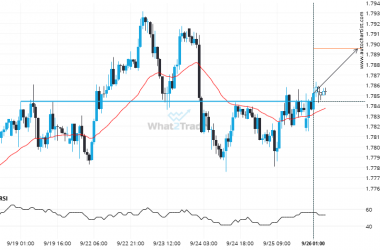
If you’re short EURAUD you should be aware that 1.7845 has just been breached – a level tested 3 time in the past
EURAUD has broken through a resistance line. Because we have seen it retrace from this price in the…
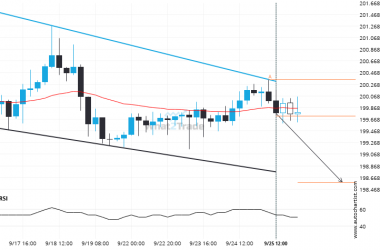
GBPJPY – approaching a support line that has been previously tested at least twice in the past
GBPJPY is heading towards the support line of a Channel Down. If this movement continues, the price of…

