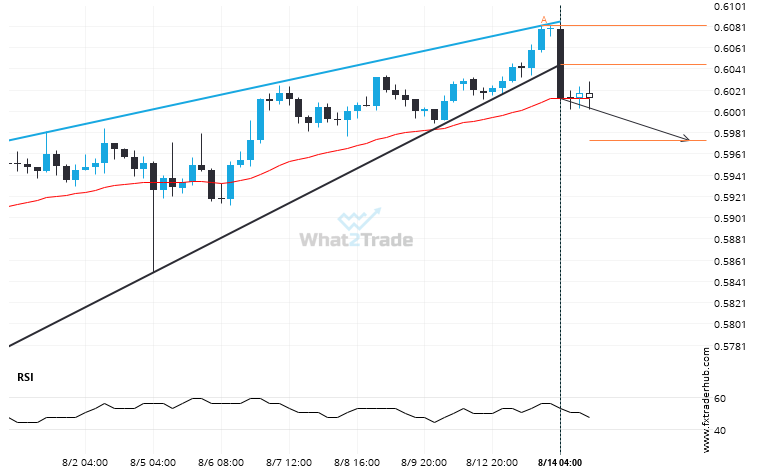
NZD/USD moved through the support line of a Rising Wedge at 0.6045466666666667 on the 4 hour chart. This line has been tested a number of times in the past and this breakout could mean an upcoming change from the current trend. It may continue in its current direction toward 0.5974.
Related Posts
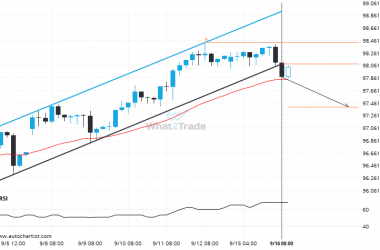
Breach of support could mean a start of a bearish trend on AUDJPY
AUDJPY has broken through a support line of a Channel Up chart pattern. If this breakout holds true,…
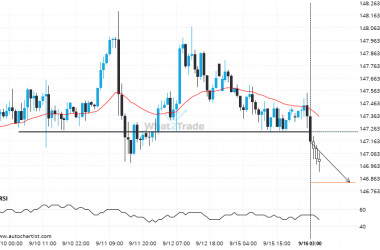
USDJPY has broken through a support line. It has touched this line numerous times in the last 7 days.
A strong support level has been breached at 147.2330 on the 1 hour USDJPY chart. Technical Analysis theory…
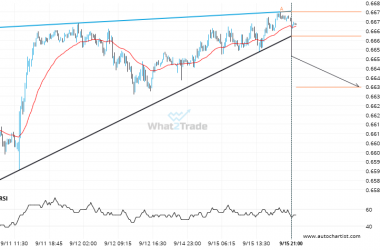
Interesting opportunity on AUDUSD after breaking 0.6661789552238805
This trade setup on AUDUSD is formed by a period of consolidation; a period in which the price…


