Receive the latest alerts via email

NVDA – breach of a trending resistance line that has been tested at least twice before.

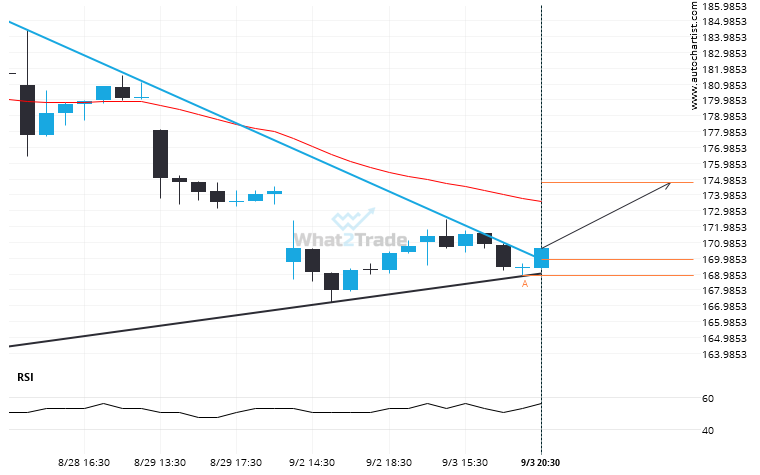
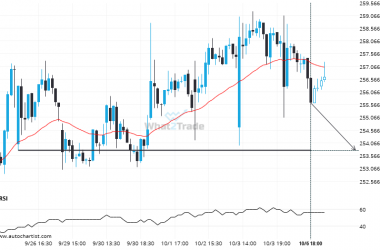
The last 8 1 hour candles on NVDA formed a Triangle pattern and broken out through the pattern lines, indicating a possible bullish movement towards the price level of 174.7810.
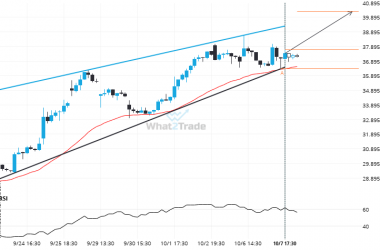
Total
0
Shares
Previous Post

Because EURGBP formed a Channel Down pattern, we expect it to touch the support line. If it breaks through support it may move much lower

Next Post

It’s time to make a decision on US Oil – its recent breach of 63.9260 could be a sign of a new trend to follow.

Related Posts