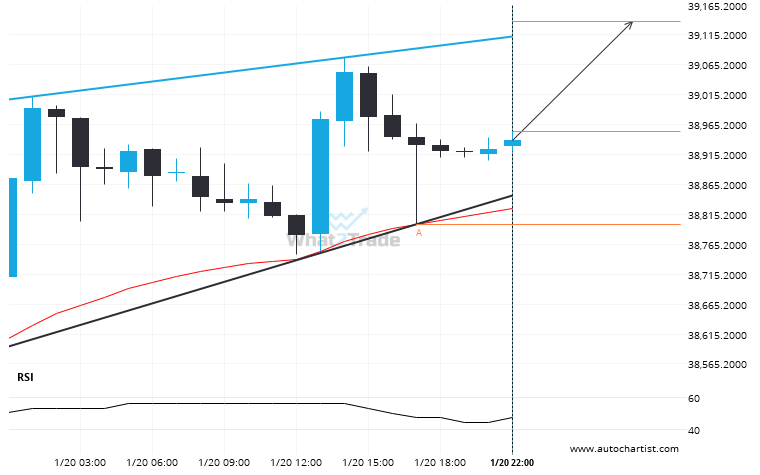
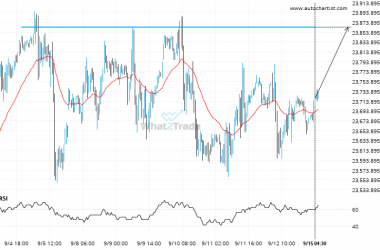
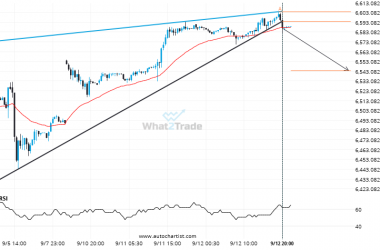
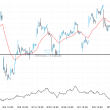
A Rising Wedge pattern was identified on Nikkei 225 at 38953.0, creating an expectation that it may move to the resistance line at 39138.0000. It may break through that line and continue the bullish trend or it may reverse from that line.
Related Posts
FTSE 100 moves higher to 8830.28 in the last 65 days.
FTSE 100 hits 8830.28 after a 15.02% move spanning 65 days.
Because CAC 40 formed a Triangle pattern, we expect it to touch the resistance line. If it breaks through resistance it may move much higher
CAC 40 is approaching the resistance line of a Triangle. It has touched this line numerous times in…
Breach of 6008.0898 could mean a start of a bullish trend on US 500
US 500 has broken through 6008.0898 which it has tested numerous times in the past. We have seen…