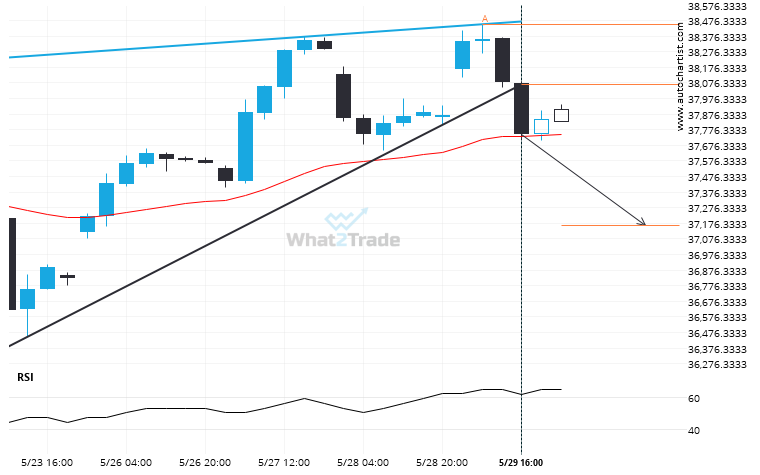
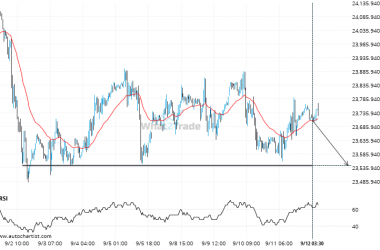
You would be well advised to confirm the breakout that has just occurred – do you believe the move through support to be significant? Do you have confirming indicators that the price momentum will continue? If so, look for a target of 37165.6666 but consider reducing the size of your position as the price gets closer to that target.
Nikkei 225 broke through a support at 2025-05-29T14:00:00.000Z, with the price momentum continuing to move in an downward direction over the next hours, good opportunity presents itself with the price expected to reach 37165.6666.