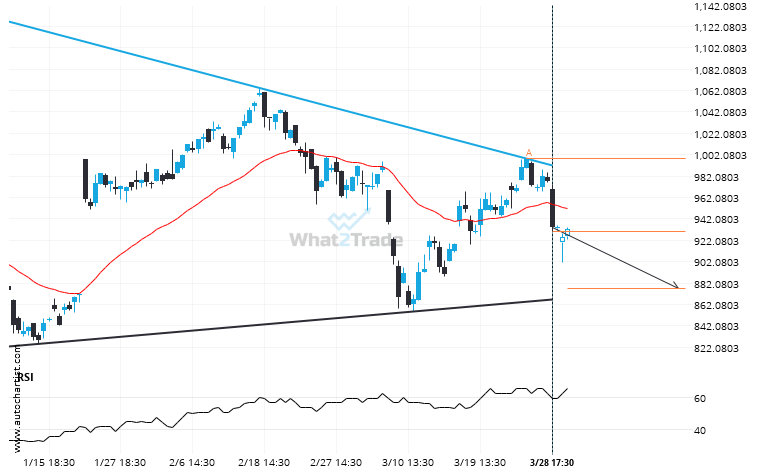
NFLX is approaching the support line of a Triangle. It has touched this line numerous times in the last 95 days. If it tests this line again, it should do so in the next 3 days.
Related Posts
Supports and resistances are primary concepts of technical analysis. AMZN is heading for an important price of 199.2800 – read about what this could mean for the future.
AMZN is moving towards a resistance line. Because we have seen it retrace from this level in the…
A Rising Wedge has formed, XOM is approaching support. Can we expect a breakout and the start of a new trend or a reversal?
Emerging Rising Wedge pattern in its final wave was identified on the XOM 15 Minutes chart. After a…
Extreme movement experienced on NKE. Check this chart to see what to do next
NKE has moved lower by 21.77% from 81.19 to 63.515 in the last 34 days.