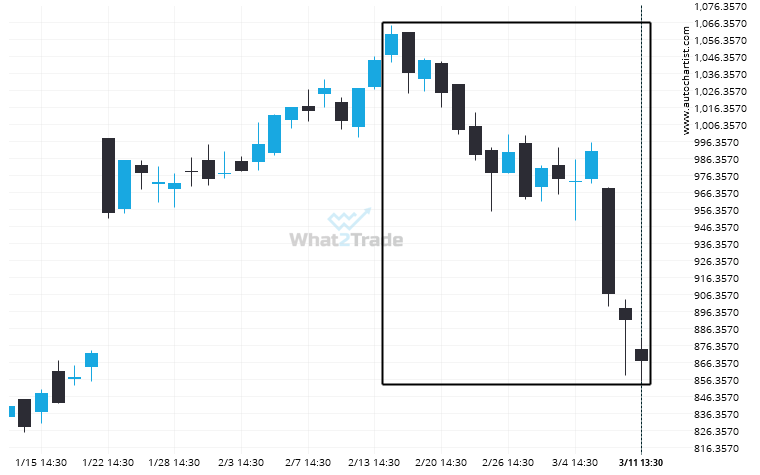
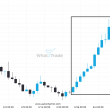
An unexpected large move has occurred on NFLX Daily chart beginning at 1059.14 and ending at 866.68. Is this a sign of something new? What can we expect in the future?
Related Posts
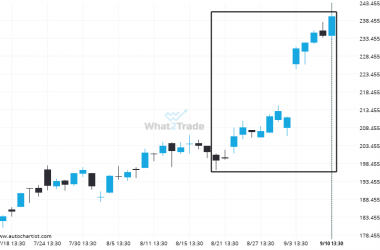
Extreme movement experienced on GOOGL. Check the chart to see what to do next.
GOOGL has moved higher by 20.22% from 199.31 to 239.61 in the last 22 days.
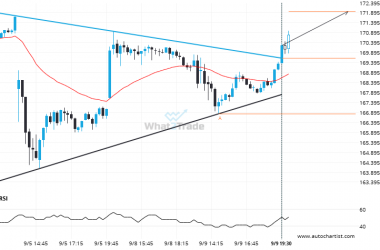
Resistance line breached by NVDA. This price has been tested at least twice before.
NVDA has broken through a resistance line. It has touched this line at least twice in the last…
BABA recorded 6 consecutive 4 hour bullish candles.
BABA posted 6 consecutive candles over the last 5 day — an unusually large movement.

