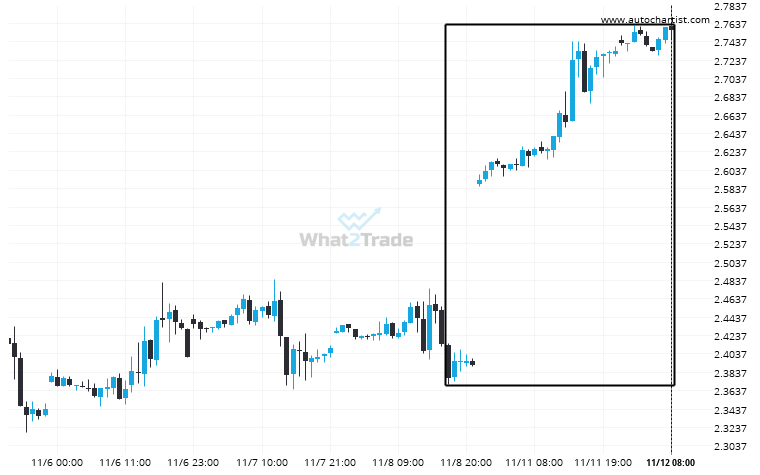
An unexpected large move has occurred on Natural Gas 1 hour chart beginning at 2.3765 and ending at 2.756. Is this a sign of something new? What can we expect in the future?
Related Posts
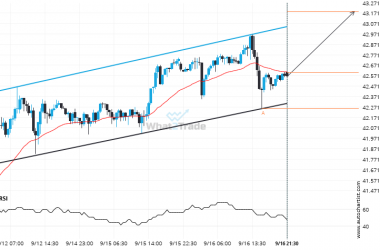
Important resistance line being approached by Silver Spot. This price has been tested numerous time in the last 6 days
An emerging Channel Up has been detected on Silver Spot on the 30 Minutes chart. There is a…
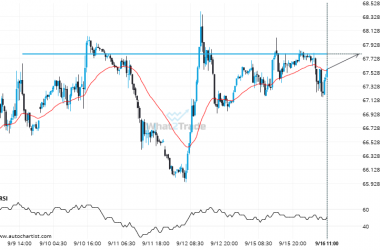
Brent Crude likely to test 67.7885 in the near future. Where to next?
Brent Crude is moving towards a key resistance level at 67.7885. This is a previously tested level for…
Important price line breached by Natural Gas. This price has been tested numerous times before.
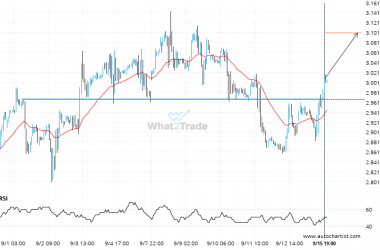
Natural Gas has breached the resistance line at 2.9680. It may continue the bullish trend towards 3.1010, or,…

