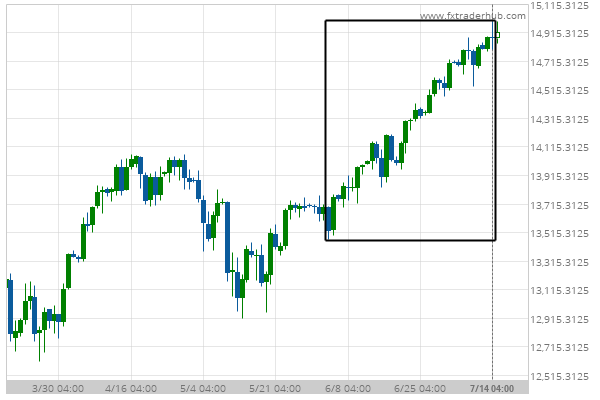
A movement of 9.98% over 42 days on NAS100 doesn’t go unnoticed. You may start considering where it’s heading next, a continuation of the current upward trend, or a reversal in the previous direction.
Related Posts
Nikkei 225 reached 47590.0 after a 3.64% move spanning 3 days.
Nikkei 225 reached 47590.0 after a 3.64% move spanning 3 days.
After testing 6741.8398 numerous times, US 500 has finally broken through. Can we expect a bullish trend to follow?
The price of US 500 in heading in the direction of 6757.0430. Despite the recent breakout through 6741.8398…
NAS 100 is approaching a resistance line of a Rising Wedge. It has touched this line numerous times in the last 11 days.
NAS 100 is heading towards the resistance line of a Rising Wedge. If this movement continues, the price…

