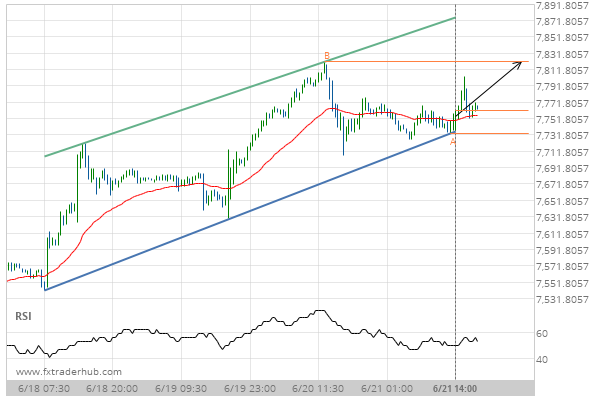
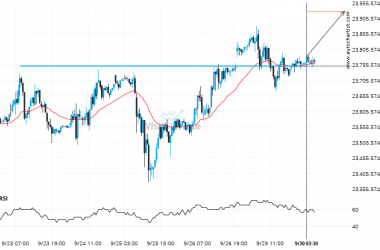
NAS100 is approaching the resistance line of a Channel Up. It has touched this line numerous times in the last 4 days. If it tests this line again, it should do so in the next 21 hours.
Related Posts
Nikkei 225 through 37689.35294117647. Is this a confirming a breakout? Will it continue its path in the current trend toward 38106.6602?
Nikkei 225 has broken through a resistance line of a Triangle chart pattern. If this breakout holds true,…
Supports and resistances are primary concepts of technical analysis. Nikkei 225 is heading for an important price of 37699.0000 – read about what this could mean for the future.
Nikkei 225 is moving towards a key resistance level at 37699.0000. This is a previously tested level for…
An unexpected large move has occurred on FTSE 100 Daily chart! Is this a sign of something new? What can we expect?
For those of you that don’t believe in trends, this may be an opportunity to take advantage of…