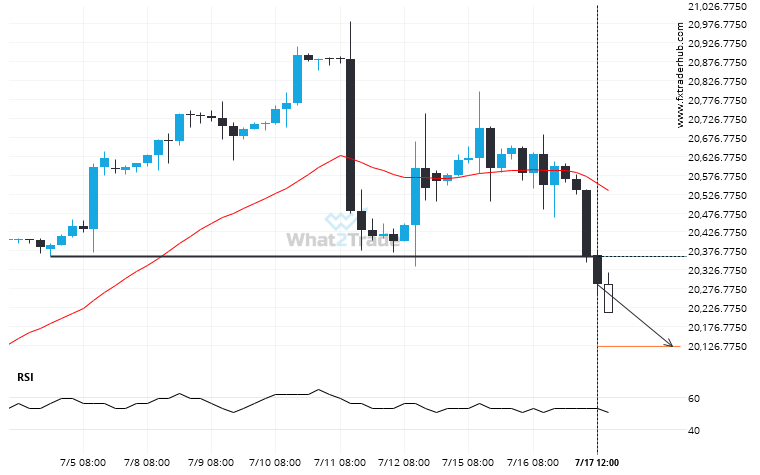
NAS100 has broken through a line of 20361.0000 and suggests a possible movement to 20123.2500 within the next 2 days. It has tested this line numerous times in the past, so one should wait for a confirmation of this breakout before taking any action. If the breakout doesn’t confirm, we could see a retracement back to lines seen in the last 13 days.
Related Posts
Nikkei 225 is signaling a possible trend reversal on the intraday charts with price not breaching support.
Nikkei 225 is approaching the resistance line of a Rising Wedge. It has touched this line numerous times…
Supports and resistances are primary concepts of technical analysis. DAX 40 is heading for an important price of 23798.8008 – read about what this could mean for the future.
A strong support level has been identified at 23798.8008 on the 30 Minutes DAX 40 chart. DAX 40…
Breach of resistance could mean a start of a bullish trend on CAC 40
Triangle pattern identified on CAC 40 has broken through a resistance level with the price momentum continuing to…