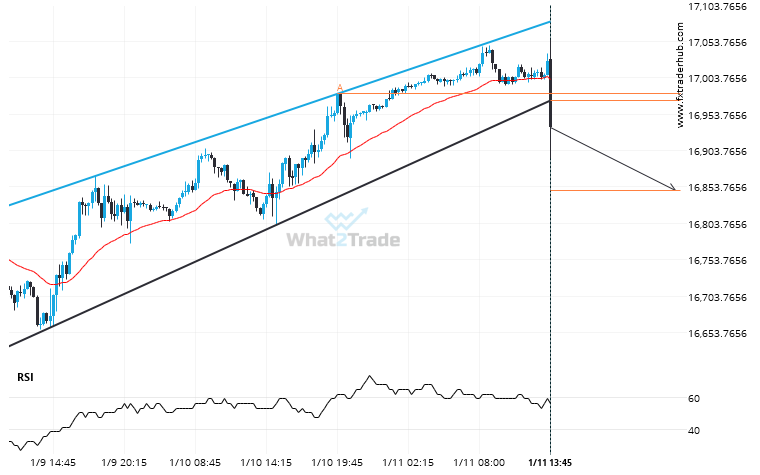
NAS100 moved through the support line of a Channel Up at 16972.731884057972 on the 15 Minutes chart. This line has been tested a number of times in the past and this breakout could mean an upcoming change from the current trend. It may continue in its current direction toward 16848.5387.
Related Posts
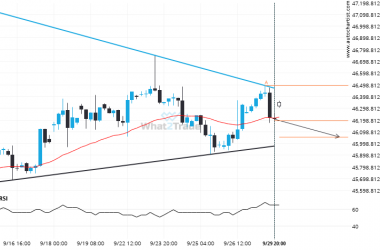
Important support line being approached by DOW 30. This price has been tested numerous time in the last 19 days
DOW 30 is moving towards a support line which it has tested numerous times in the past. We…
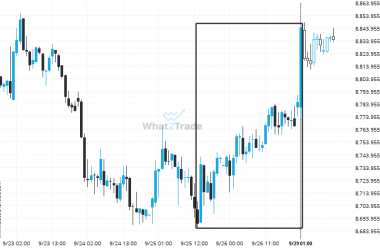
ASX 200 experienced a 1.78% bullish move in just 4 days. The magnitude speaks for itself.
ASX 200 has moved higher by 1.78% from 8689.4 to 8844.2 in the last 4 days.
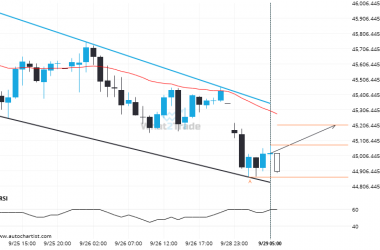
A possible move on Nikkei 225 as it heads towards resistance
Emerging Channel Down pattern in its final wave was identified on the Nikkei 225 1 hour chart. After…

