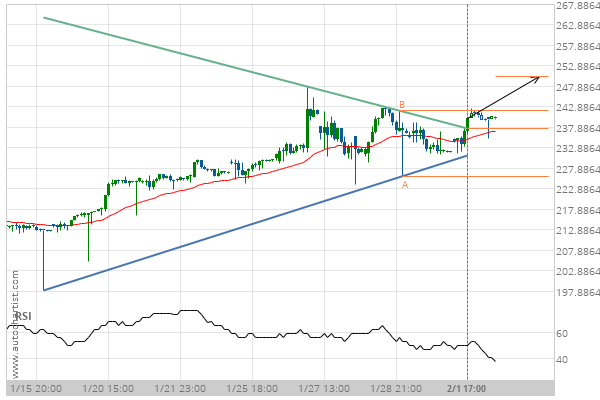
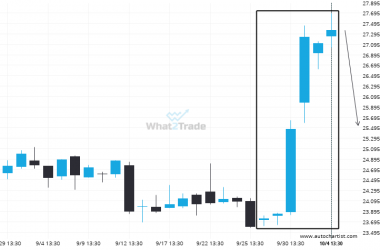
Microsoft Corporation has broken through the resistance line of a Triangle technical chart pattern. Because we have seen it retrace from this position in the past, one should wait for confirmation of the breakout before trading. It has touched this line twice in the last 17 days and suggests a target line to be around 250.21 within the next 2 days.
Related Posts
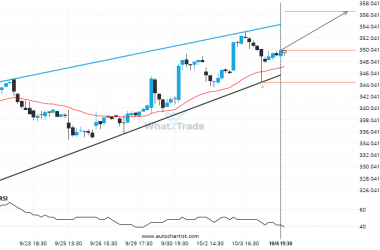
V formed a Rising Wedge on the 1 hour chart. Retest of resistance in sight.
V is heading towards the resistance line of a Rising Wedge and could reach this point within the…
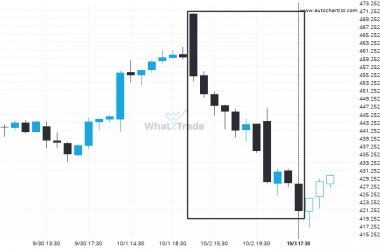
Extreme movement experienced on TSLA. Check the chart to see what to do next.
TSLA recorded a considerable move in the last day — one of its biggest in recent sessions.
PFE has formed 6 bullish candles in a row.
PFE experienced a high number of bullish candles reaching 27.3650 over 9 days.

