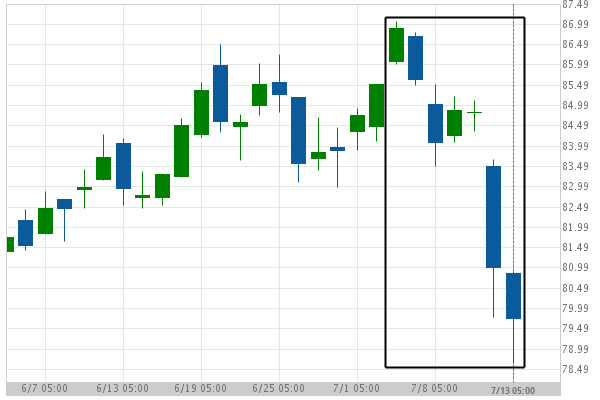
A movement of 7.36% over 11 days on Merck & Co. Inc. doesn’t go unnoticed. You may start considering where it’s heading next, a continuation of the current downward trend, or a reversal in the previous direction.
Related Posts
AAPL – approaching a price line that has been previously tested numerous times in the past
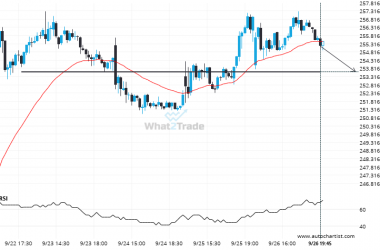
AAPL is heading towards a line of 253.6100. If this movement continues, the price of AAPL could test…
AMZN posted 7 consecutive bearish Daily candles.
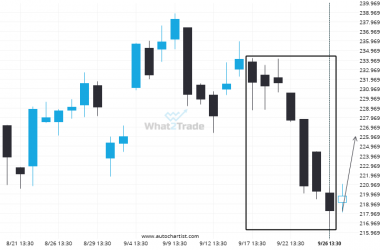
AMZN moved lower from 233.7700 to 218.1650 after 7 consecutive daily candles over 10 days.
XOM – breach of price line that’s been previously tested numerous times before
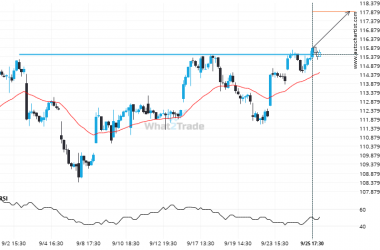
XOM has breached the resistance line at 115.4800. It may continue the bullish trend towards 117.9020, or, it…

