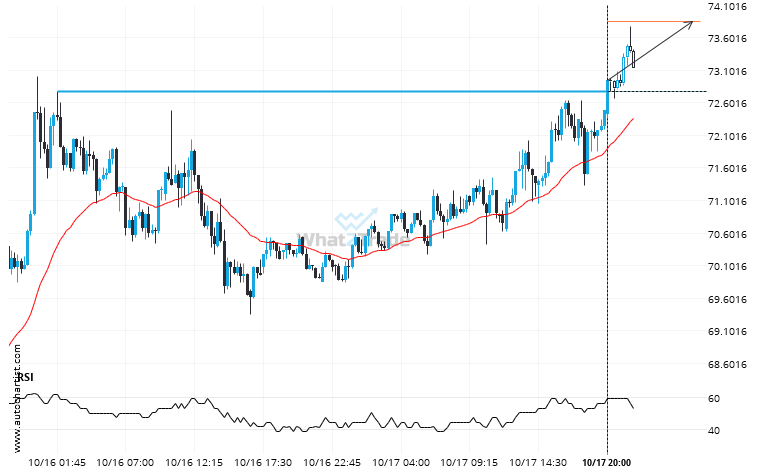
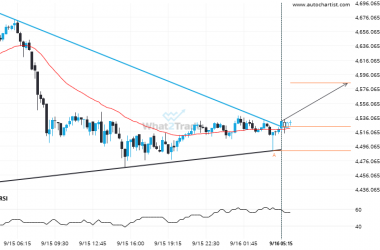
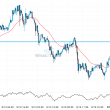
LTCUSD is once again retesting a key horizontal resistance level at 72.7700. It has tested this level 3 times in the recent past and could simply bounce off like it did last time. However, after this many tries, maybe it’s ready to start a new trend.
Related Posts
An unexpected large move has occurred on ETHBTC Daily chart! Is this a sign of something new? What can we expect?
ETHBTC hits 0.01864 after a 21.32% move spanning 34 days.
Breach of resistance could mean a start of a bullish trend on ADAUSD
The breakout of ADAUSD through the resistance line of a Triangle could be a sign of the road…
LTCEUR has broken through a level it has tested 3 times in the recent past.
The breakout of LTCEUR through the 67.6500 price line is a breach of an important psychological price that…