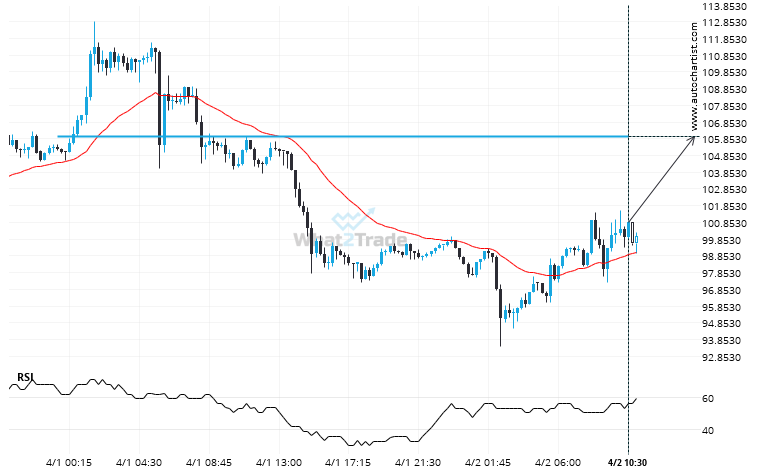
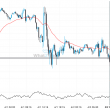
LTCUSD is approaching a resistance line at 105.9800. If it hits the resistance line, it may break through this level to continue the bullish trend, or it may turn around back to current levels.
Related Posts
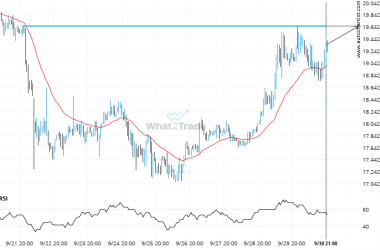
Will DASHEUR break through the resistance level it tested before?
DASHEUR is moving towards a line of 19.6500 which it has tested numerous times in the past. We…
After testing the support line numerous times, XRPUSD is once again approaching this line. Can we expect a bearish trend to follow?
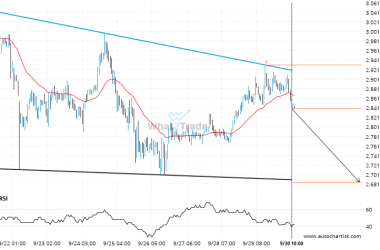
Emerging Descending Triangle pattern in its final wave was identified on the XRPUSD 1 hour chart. After a…
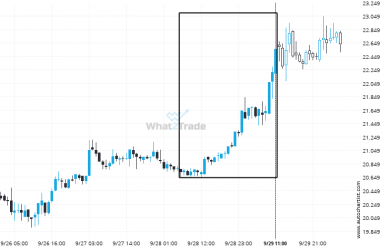
DASHUSD experienced a 8.88% bullish move in just 2 days. The magnitude speaks for itself.
DASHUSD reached 22.56 after a 8.88% move spanning 2 days.

