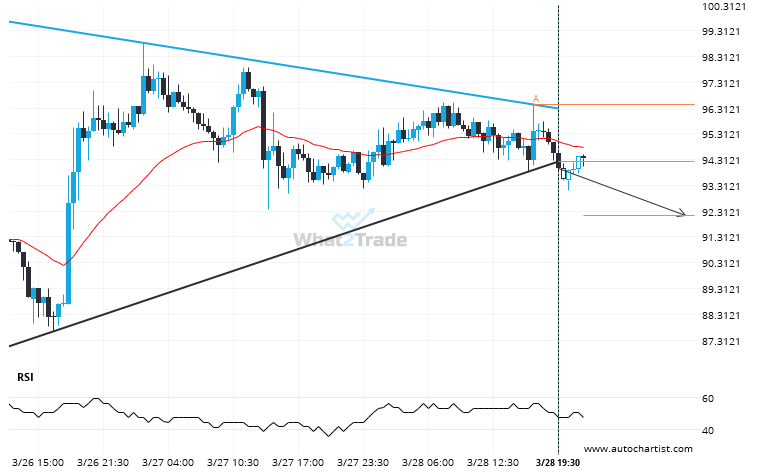
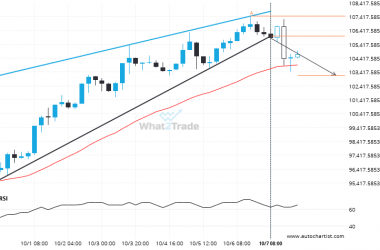
LTCUSD has broken through a support line of a Triangle chart pattern. If this breakout holds true, we may see the price of LTCUSD testing 92.1281 within the next 14 hours. But don’t be so quick to trade, it has tested this line in the past, so you should confirm the breakout before taking any action.
Related Posts
DASHBTC breakout from a Inverse Head and Shoulders trade setup. Will it continue this trend to hit the target price?
The breakout of DASHBTC through the resistance line of a Inverse Head and Shoulders could be a sign…
Important price line being approached by BTCEUR. This price has been tested numerous times before.
A strong resistance level has been identified at 77725.7031 on the 15 Minutes BTCEUR chart. BTCEUR is likely…
XRPUSD is approaching a support line of a Falling Wedge. It has touched this line numerous times in the last 7 days.
XRPUSD is heading towards the support line of a Falling Wedge. If this movement continues, the price of…