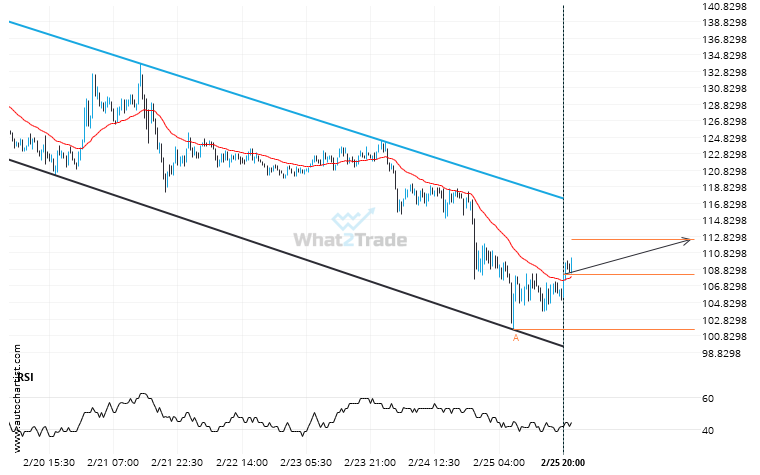
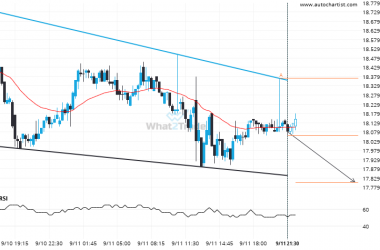
Emerging Channel Down pattern in its final wave was identified on the LTCEUR 30 Minutes chart. After a strong bullish run, we find LTCEUR heading towards the upper triangle line with a possible resistance at 112.4650. If the resistance shows to hold, the Channel Down pattern suggests a rebound back towards current levels.
Related Posts
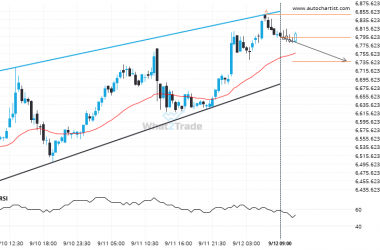
Because ETHAUD formed a Rising Wedge pattern, we expect it to touch the support line. If it breaks through support it may move much lower
Emerging Rising Wedge detected on ETHAUD – the pattern is an emerging one and has not yet broken…
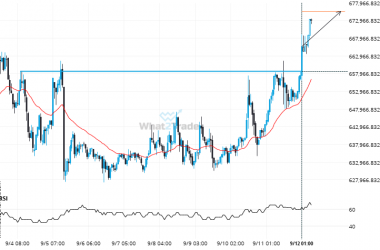
It’s time to make a decision on ETHJPY – its recent breach of 658561.4375 could be a sign of a new trend to follow.
The breakout of ETHJPY through the 658561.4375 price line is a breach of an important psychological price that…
A Falling Wedge has formed, DASHGBP is approaching resistance. Can we expect a breakout and the start of a new trend or a reversal?
The movement of DASHGBP towards the support line of a Falling Wedge is yet another test of the…


