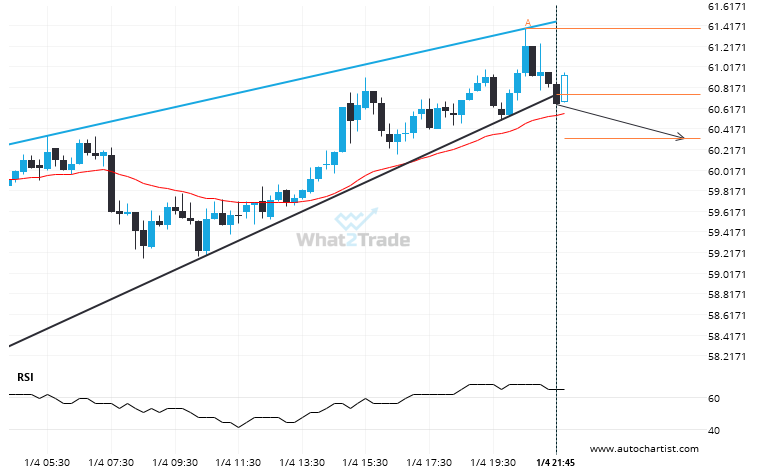
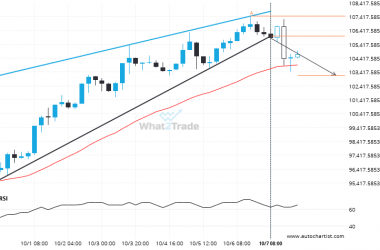
LTCEUR moved through the support line of a Rising Wedge at 60.747837837837835 on the 15 Minutes chart. This line has been tested a number of times in the past and this breakout could mean an upcoming change from the current trend. It may continue in its current direction toward 60.3242.
LTCEUR broke through a support at 2024-01-04T23:30:00.000Z, with the price momentum continuing to move in an downward direction over the next hours, good opportunity presents itself with the price expected to reach 60.3242.