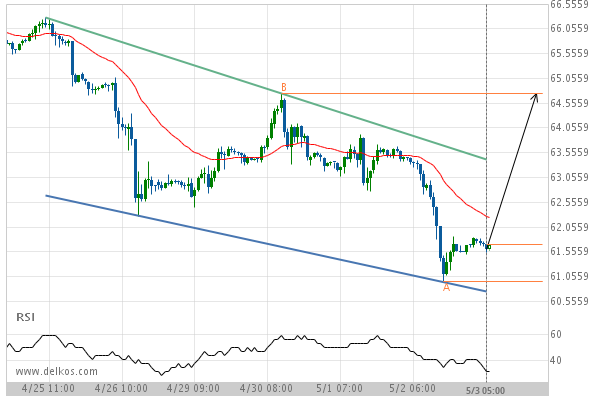
Channel Down identified at 03-May-2019 05:00 UTC. This pattern is still in the process of forming. Possible bullish price movement towards the resistance 64.7500 within the next 2 days.
Light Sweet Crude Oil JUNE 2019 Target Level: 64.7500

Channel Down identified at 03-May-2019 05:00 UTC. This pattern is still in the process of forming. Possible bullish price movement towards the resistance 64.7500 within the next 2 days.