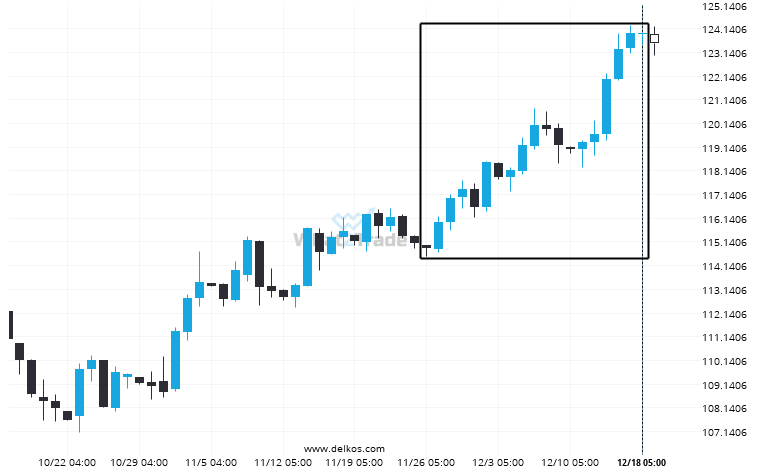
An unexpected large move has occurred on Us Treasury Bond March 2024 Daily chart beginning at 114.84375 and ending at 123.90625. Is this a sign of something new? What can we expect in the future?
Related Posts
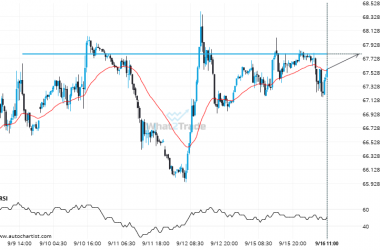
Brent Crude likely to test 67.7885 in the near future. Where to next?
Brent Crude is moving towards a key resistance level at 67.7885. This is a previously tested level for…
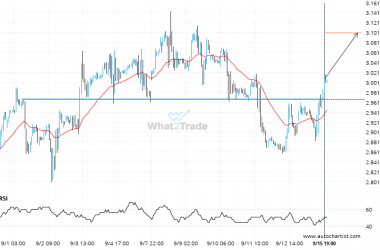
Important price line breached by Natural Gas. This price has been tested numerous times before.
Natural Gas has breached the resistance line at 2.9680. It may continue the bullish trend towards 3.1010, or,…
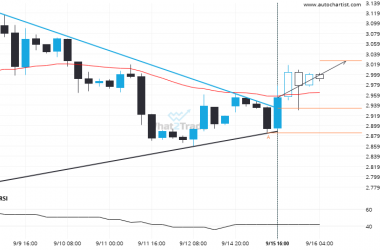
Natural Gas through 2.9335. Is this a confirming a breakout? Will it continue its path in the current trend toward 3.0254?
Natural Gas has broken through the resistance line which it has tested twice in the past. We have…

