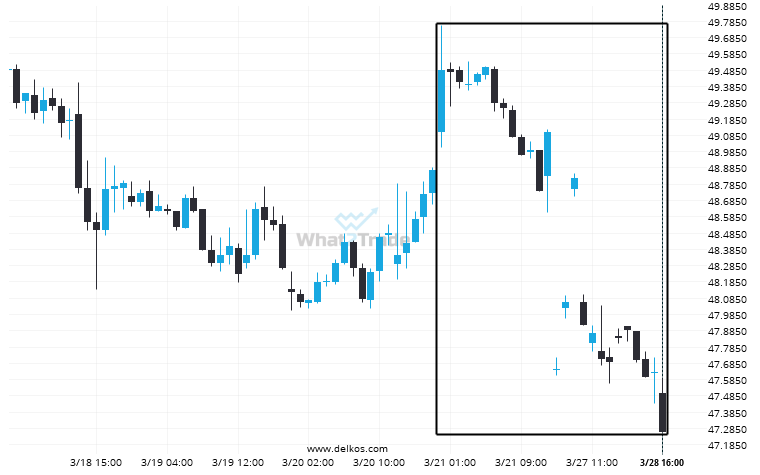
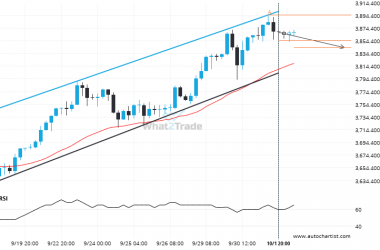
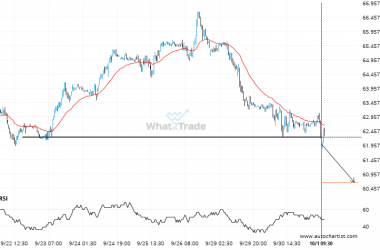
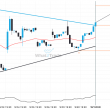
An unexpected large move has occurred on Soybean Oil May 2024 1 hour chart beginning at 49.48 and ending at 47.26. Is this a sign of something new? What can we expect in the future?
Related Posts
US Oil – approaching a support line that has been previously tested at least twice in the past
US Oil was identified at around 63.741 having recently rebounded of the resistance on the 30 Minutes data…
Will Gold Spot break through the support level it tested before?
The movement of Gold Spot towards 3370.6250 price line is yet another test of the line it reached…
Silver Spot – approaching a resistance line that has been previously tested at least twice in the past
Silver Spot is heading towards the resistance line of a Rising Wedge and could reach this point within…