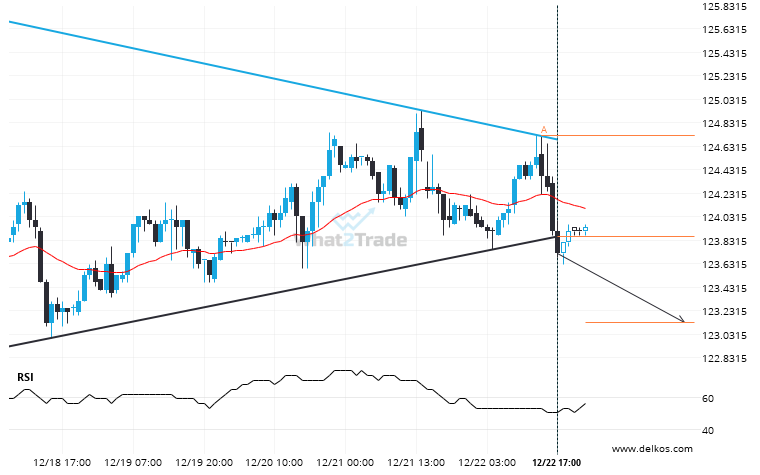
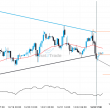
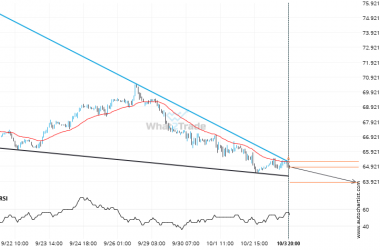
Us Treasury Bond March 2024 moved through the support line of a Triangle at 123.86111111111111 on the 1 hour chart. This line has been tested a number of times in the past and this breakout could mean an upcoming change from the current trend. It may continue in its current direction toward 123.1359.
Related Posts
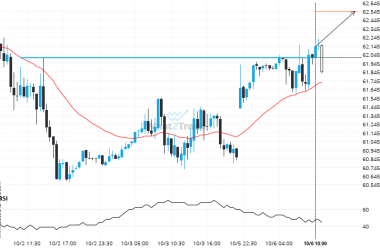
Important price line breached by US Oil. This price has been tested numerous times before.
US Oil has broken through a resistance line. Because we have seen it retrace from this price in…
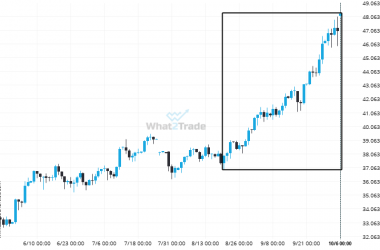
A very large move was recorded on Silver Spot. The size of the shift is exceptional.
Silver Spot just posted a 27.23% move over the past 48 days – a move that won’t go…
Brent Crude formed a Falling Wedge on the 1 hour chart. Retest of support in sight.
Emerging Falling Wedge detected on Brent Crude – the pattern is an emerging one and has not yet…

