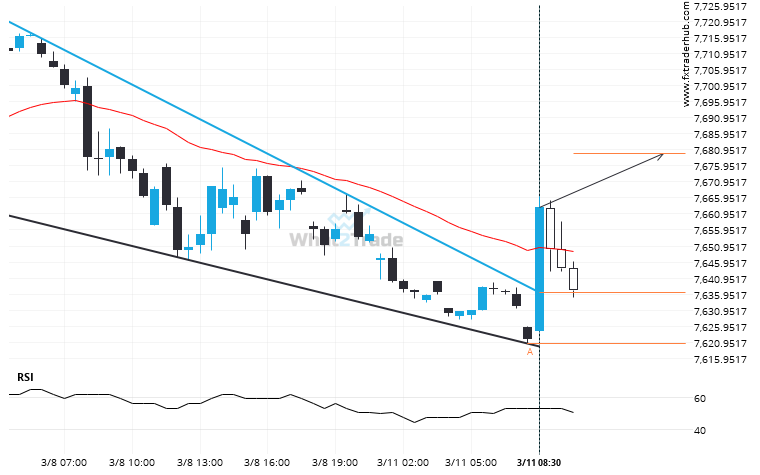
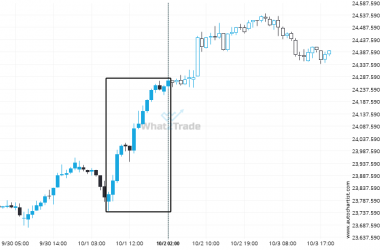
UK100 moved through the resistance line of a Falling Wedge at 7636.4629629629635 on the 30 Minutes chart. This line has been tested a number of times in the past and this breakout could mean an upcoming change from the current trend. It may continue in its current direction toward 7679.7334.
Related Posts
DOW 30 hits 43420.26 after a 1.91% move spanning 12 hours
DOW 30 hits 43420.26 after a 1.91% move spanning 12 hours.
Nikkei 225 keeps moving closer towards 39216.0000. Will it finally breach this level?
Nikkei 225 is heading towards 39216.0000 and could reach this point within the next 3 days. It has…
DOW 30 through 44390.40419354839. Is this a confirming a breakout? Will it continue its path in the current trend toward 43870.8429?
The last 11 4 hour candles on DOW 30 formed a Triangle pattern and broken out through the…