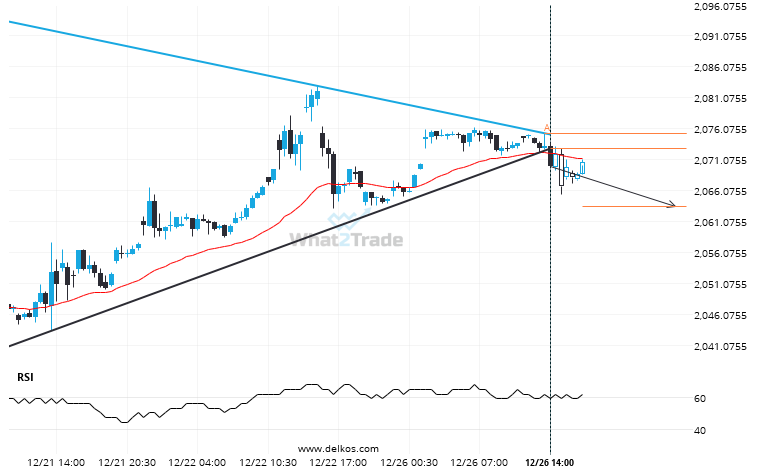
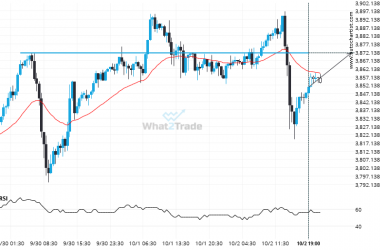
The last 6 30 Minutes candles on Gold February 2024 formed a Triangle pattern and broken out through the pattern lines, indicating a possible bearish movement towards the price level of 2063.5374.
Related Posts
A Channel Up has formed, Natural Gas is approaching support. Can we expect a breakout and the start of a new trend or a reversal?
Natural Gas was identified at around 2.756 having recently rebounded of the support on the 1 hour data…
If Natural Gas touches 2.7115 it may be time to take action.
The price of Natural Gas in heading back to the support area. It is possible that it will…
Resistance line breached by Gold Spot. This price has been tested at least twice before.
The last 21 4 hour candles on Gold Spot formed a Falling Wedge pattern and broken out through…