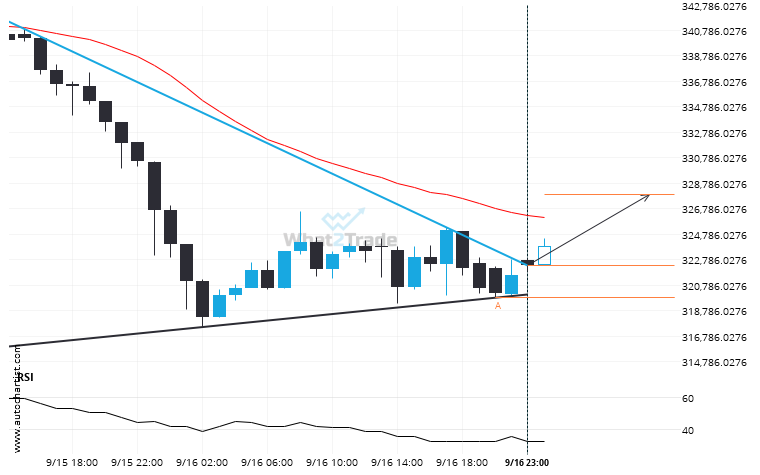
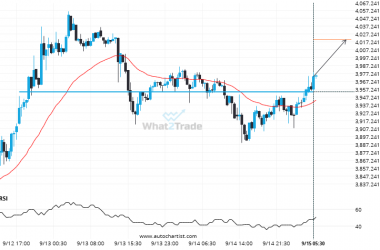
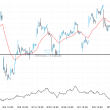
ETHJPY moved through the resistance line of a Triangle at 322312.754 on the 1 hour chart. This line has been tested a number of times in the past and this breakout could mean an upcoming change from the current trend. It may continue in its current direction toward 327903.2234.
Related Posts
After testing support twice in the past, ADAUSD has finally broken through. Can we expect a bearish trend to follow?
You would be well advised to confirm the breakout that has just occurred – do you believe the…
It’s time to make a decision on ETHEUR – its recent breach of 3953.8899 could be a sign of a new trend to follow.
ETHEUR has breached the resistance line at 3953.8899. It may continue the bullish trend towards 4020.4871, or, it…
A possible move by DASHUSD towards 23.2361
DASHUSD has broken through a support line of a Triangle chart pattern. If this breakout holds true, we…