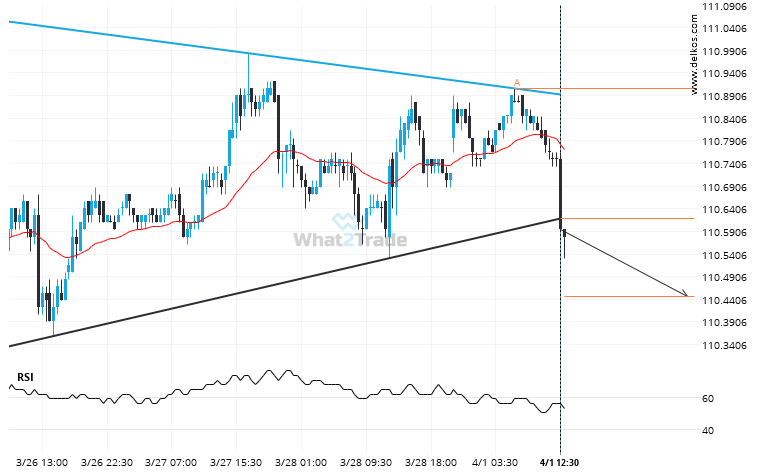
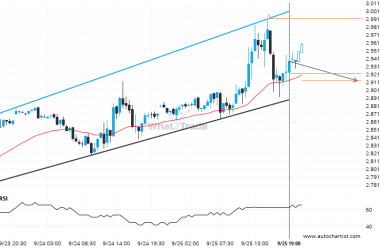
10 Yr Us Treasury Note June 2024 moved through the support line of a Triangle at 110.619140625 on the 30 Minutes chart. This line has been tested a number of times in the past and this breakout could mean an upcoming change from the current trend. It may continue in its current direction toward 110.4460.
Related Posts
Gold Spot – breach of a trending support line that has been tested at least twice before.
This trade setup on Gold Spot is formed by a period of consolidation; a period in which the…
Gold Spot seems to be on its way to resistance – a possible opportunity?
Gold Spot is approaching a resistance line at 3761.6851. If it hits the resistance line, it may break…
Important support line being approached by Natural Gas. This price has been tested numerous time in the last 3 days
A Channel Up pattern was identified on Natural Gas at 2.9215, creating an expectation that it may move…

