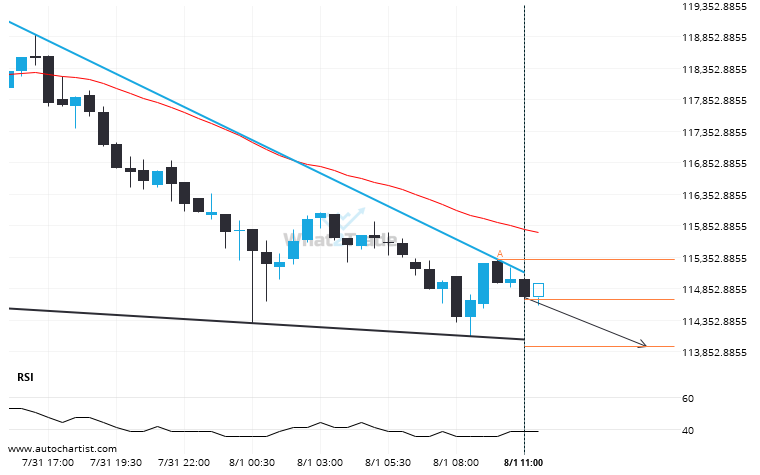
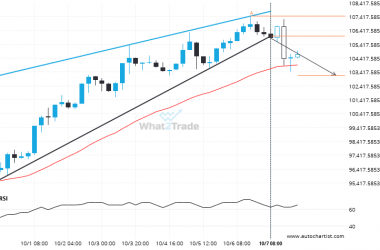
Emerging Falling Wedge pattern in its final wave was identified on the BTCUSD 30 Minutes chart. After a strong bearish run, we find BTCUSD heading towards the upper triangle line with a possible resistance at 113935.5356. If the support shows to hold, the Falling Wedge pattern suggests a rebound back towards current levels.
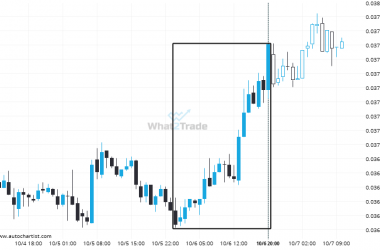
Related Posts
If BTCEUR touches 98853.5625 it may be time to take action.
The movement of BTCEUR towards 98853.5625 price line is yet another test of the line it reached numerous…
After testing support twice in the past, ADAUSD has finally broken through. Can we expect a bearish trend to follow?
You would be well advised to confirm the breakout that has just occurred – do you believe the…
It’s time to make a decision on ETHEUR – its recent breach of 3953.8899 could be a sign of a new trend to follow.
ETHEUR has breached the resistance line at 3953.8899. It may continue the bullish trend towards 4020.4871, or, it…