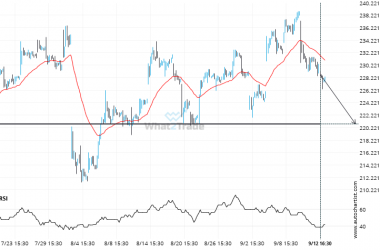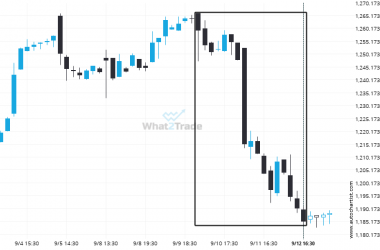
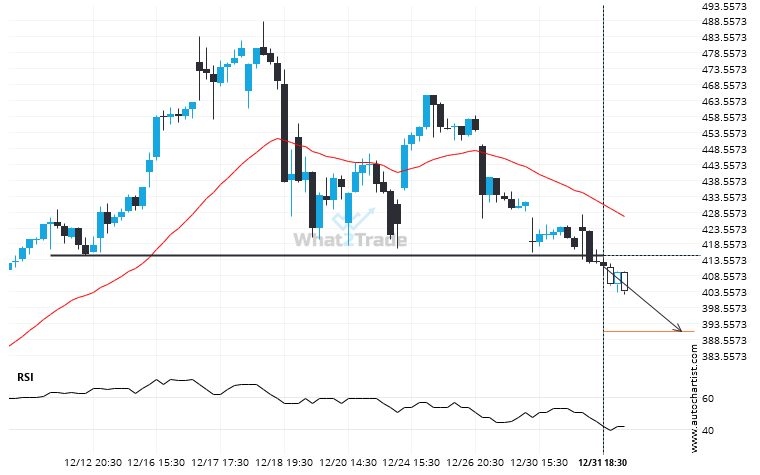
A strong support level has been breached at 415.0000 on the 1 hour TSLA chart. Technical Analysis theory forecasts a movement to 391.0120 in the next 16 hours.
Important price line breached by TSLA. This price has been tested numerous times before.

A strong support level has been breached at 415.0000 on the 1 hour TSLA chart. Technical Analysis theory forecasts a movement to 391.0120 in the next 16 hours.