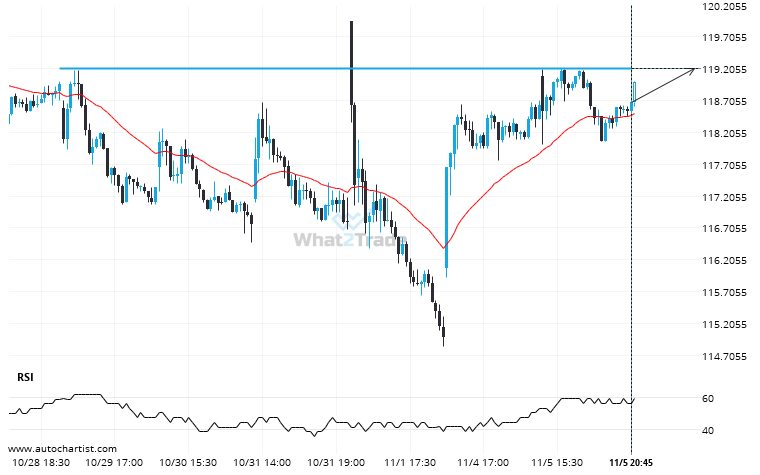
XOM is moving towards a line of 119.2100 which it has tested numerous times in the past. We have seen it retrace from this position in the past, so at this stage it isn’t clear whether it will breach this price or rebound as it did before. If XOM continues in its current trajectory, we may see it move towards 119.2100 within the next 9 hours.
Related Posts
XOM is signaling a possible trend reversal on the intraday charts with price not breaching support.
XOM was identified at around 115.01 having recently rebounded of the support on the 15 Minutes data interval.…
BRK.B may be on a start of a new bearish trend after its breakout through this important support level
BRK.B has broken through a line of 481.9500. If this breakout holds true, we could see the price…
A possible move on PFE as it heads towards support
Emerging Channel Up pattern in its final wave was identified on the PFE 1 hour chart. After a…