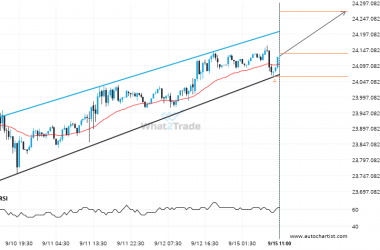
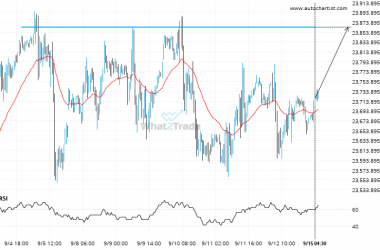
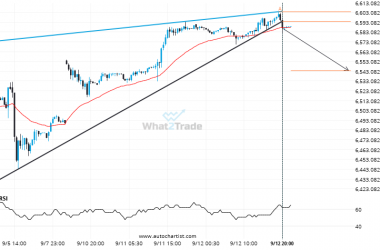
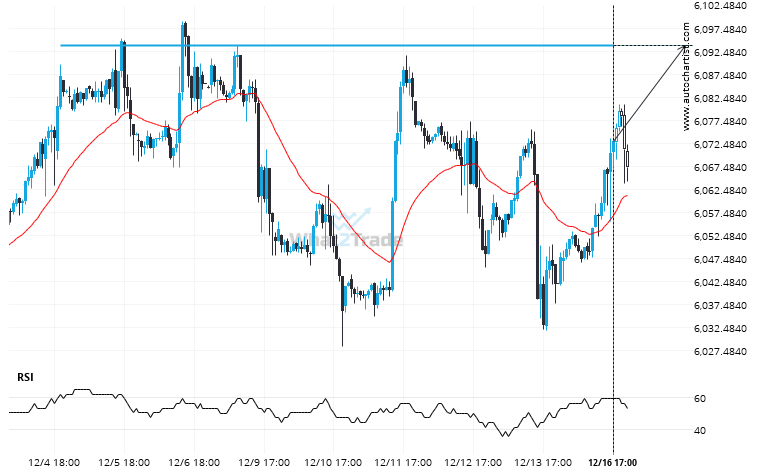
A strong resistance level has been identified at 6093.5898 on the 1 hour US 500 chart. US 500 is likely to test it soon.
Related Posts
Could 4 consecutive daily bullish candles on ASX 200 be a sign of things to come?
For those of you that don’t believe in trends, this may be an opportunity to take advantage of…
If FTSE 100 touches 9009.0596 it may be time to take action.
The price of FTSE 100 in heading back to the resistance area. It is possible that it will…
Because CAC 40 formed a Triangle pattern, we expect it to touch the support line. If it breaks through support it may move much lower
CAC 40 is moving towards a support line. Because we have seen it retrace from this line before,…