Emerging Triangle pattern in its final wave was identified on the GOOGL 4 hour chart. After a strong bearish run, we find GOOGL heading towards the upper triangle line with a possible resistance at 173.0784. If the support shows to hold, the Triangle pattern suggests a rebound back towards current levels.
Related Posts
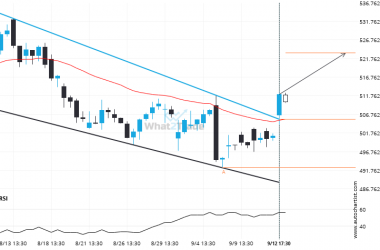
Resistance line breached by MSFT. This price has been tested at least twice before.
MSFT has broken through a resistance line of a Channel Down chart pattern. If this breakout holds true,…
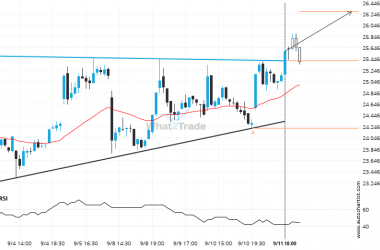
MRNA breakout from a Ascending Triangle trade setup. Will it continue this trend to hit the target price?
This trade setup on MRNA is formed by a period of consolidation; a period in which the price…
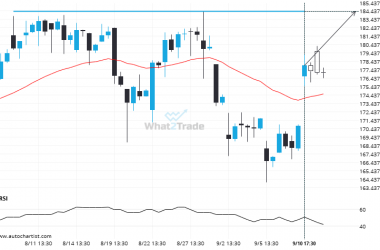
NVDA is quickly approaching a very important level it has previously tested numerous times in the past
NVDA is heading towards 184.4200 and could reach this point within the next 15 hours. It has tested…

