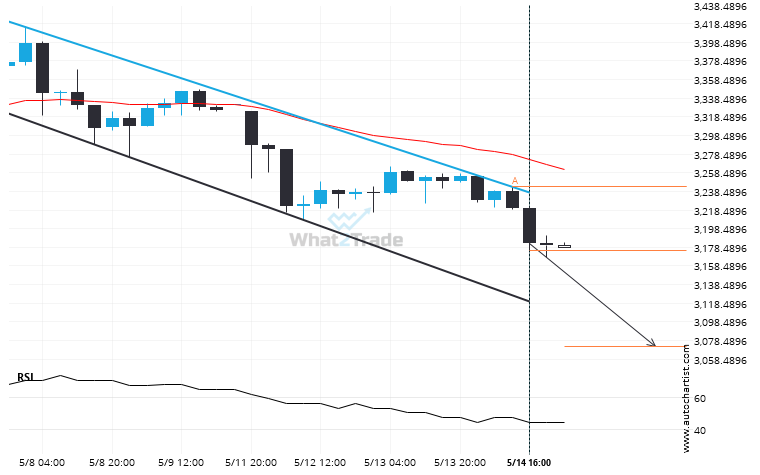
A Flag pattern was identified on Gold Spot at 3174.8255, creating an expectation that it may move to the support line at 3071.8684. It may break through that line and continue the bearish trend or it may reverse from that line.
Related Posts
Because Silver Spot formed a Channel Down pattern, we expect it to touch the support line. If it breaks through support it may move much lower
Silver Spot is trapped in a Channel Down formation, implying that a breakout is Imminent. This is a…
Natural Gas is currently testing a level of 3.5315. Will the breakout continue or will things reverse?
The breakout of Natural Gas through the 3.5315 price line is a breach of an important psychological price…
Silver Spot formed a Triangle on the 30 Minutes chart. Retest of resistance in sight.
Silver Spot was identified at around 32.733 having recently rebounded of the support on the 30 Minutes data…