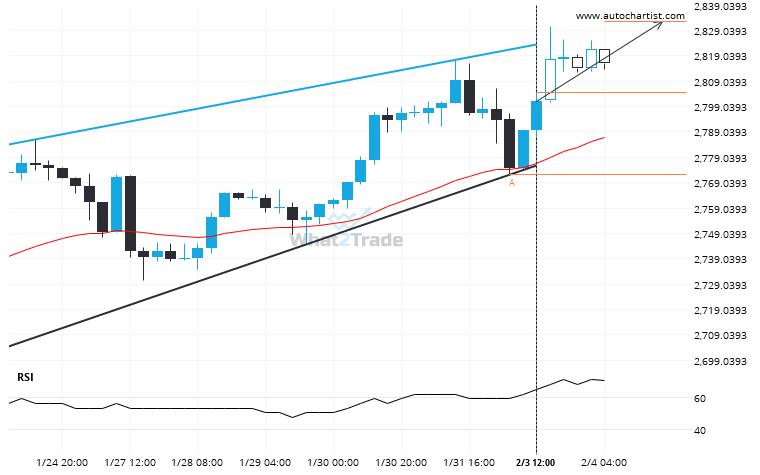
Emerging Rising Wedge pattern in its final wave was identified on the Gold Spot 4 hour chart. After a strong bullish run, we find Gold Spot heading towards the upper triangle line with a possible resistance at 2832.6282. If the resistance shows to hold, the Rising Wedge pattern suggests a rebound back towards current levels.
Related Posts
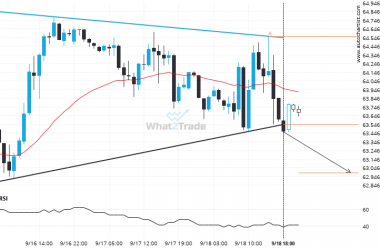
US Oil breakout from a Triangle trade setup. Will it continue this trend to hit the target price?
This trade setup on US Oil is formed by a period of consolidation; a period in which the…
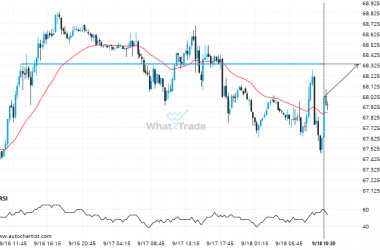
Important price line being approached by Brent Crude. This price has been tested numerous times before.
Brent Crude is moving towards a key resistance level at 68.3375. This is a previously tested level for…
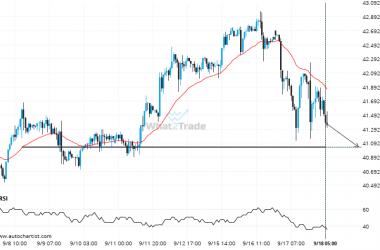
Silver Spot seems to be on its way to support – a possible opportunity?
Silver Spot is heading towards a line of 41.0334. If this movement continues, the price of Silver Spot…

