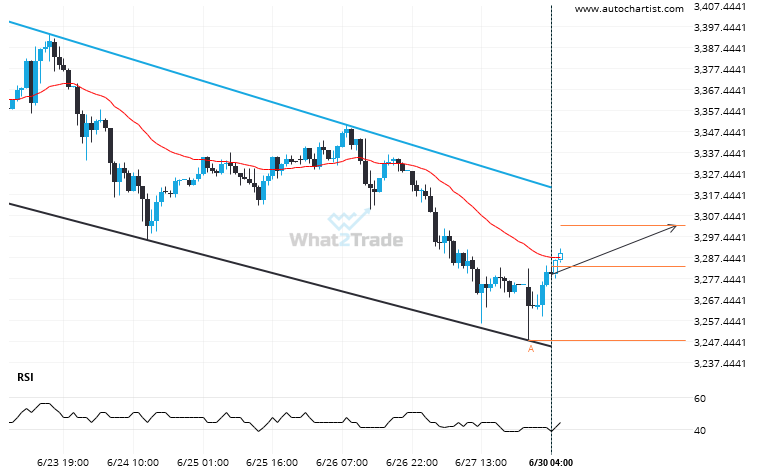
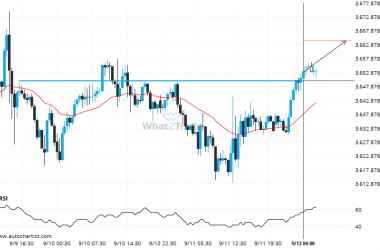
Gold Spot was identified at around 3282.8995 having recently rebounded of the support on the 1 hour data interval. Ultimately, the price action of the stock has formed a Channel Down pattern. This squeeze may increases the chances of a strong breakout. The projected movement will potentially take the price to around the 3302.4351 level.
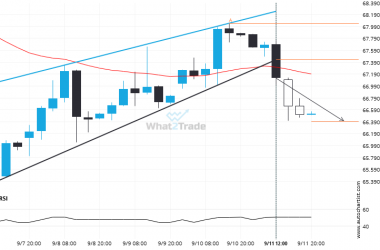
Gold Spot is quickly approaching the resistance line of a Channel Down. We expect either a breakout through this line or a rebound.