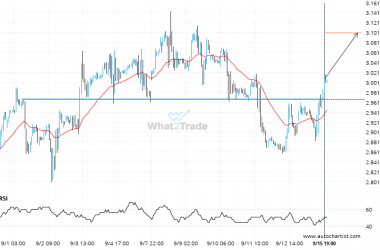
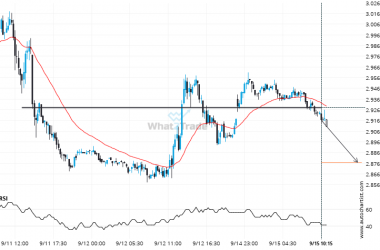
Gold Spot has broken through the support line which it has tested twice in the past. We have seen it retrace from this line before, so one should wait for confirmation of the breakout before trading. If this new trend persists, a target level of around 2661.7071 may materialize within the next 16 hours.
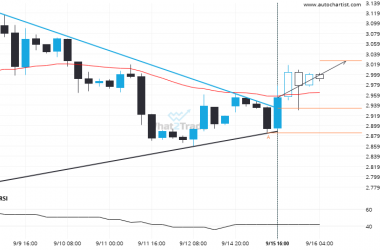
Related Posts
Natural Gas is signaling a possible trend reversal on the intraday charts with price not breaching support.
Natural Gas is trapped in a Channel Up formation, implying that a breakout is Imminent. This is a…
US Oil broke through a support at 2025-06-03T10:30:00.000Z, with the price momentum continuing to move in an downward direction over the next hours, good opportunity presents itself with the price expected to reach 62.1697.
The breakout of US Oil through the support line of a Triangle could be a sign of the…
Brent Crude breakout from a Triangle trade setup. Will it continue this trend to hit the target price?
Brent Crude has broken through a support line of a Triangle chart pattern. If this breakout holds true,…