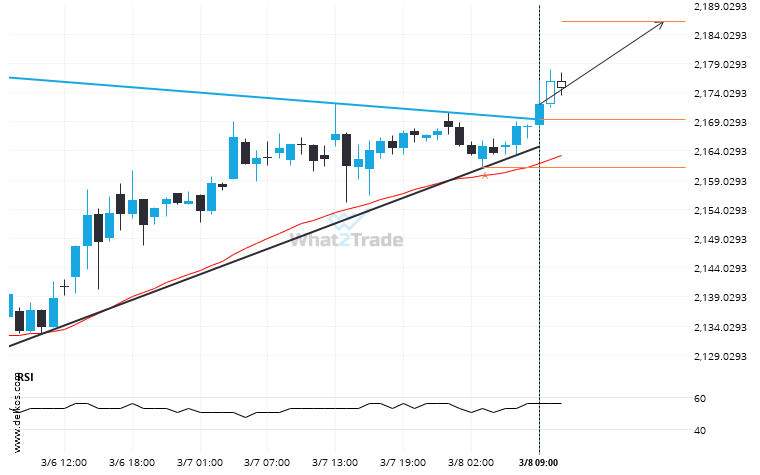
The last 3 1 hour candles on Gold April 2024 formed a Triangle pattern and broken out through the pattern lines, indicating a possible bullish movement towards the price level of 2186.2426.
Related Posts
Natural Gas – approaching a price line that has been previously tested numerous times in the past
Natural Gas is heading towards 3.1605 and could reach this point within the next 2 days. It has…
Gold Spot is signaling a possible trend reversal on the intraday charts with price not breaching resistance.
Gold Spot was identified at around 3281.72 having recently rebounded of the resistance on the 1 hour data…
Natural Gas keeps moving closer towards 3.1550. Will it finally breach this level?
Natural Gas is moving towards a key resistance level at 3.1550. This is a previously tested level for…