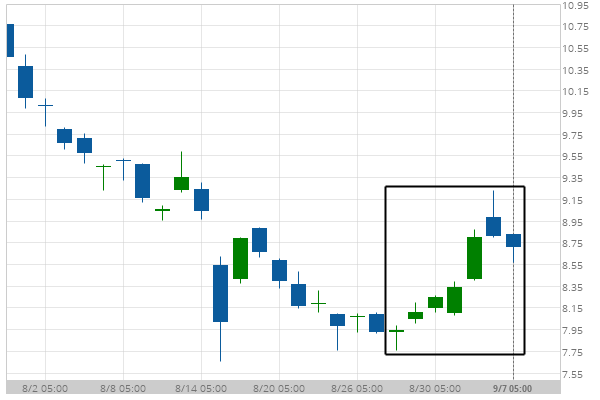
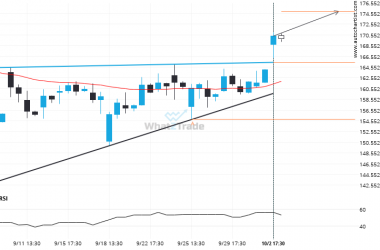
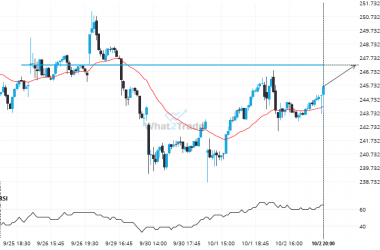
A movement of 9.85% over 11 days on General Electric Co. doesn’t go unnoticed. You may start considering where it’s heading next, a continuation of the current upward trend, or a reversal in the previous direction.
Related Posts
If you’re short AAPL you should be aware that 257.2950 has just been breached – a level tested 3 time in the past
AAPL is once again retesting a key horizontal resistance level at 257.2950. It has tested this level 3…
AMD – breach of a trending resistance line that has been tested at least twice before.
The breakout of AMD through the resistance line of a Ascending Triangle could be a sign of the…
GOOGL keeps moving closer towards 247.2200. Will it finally breach this level?
GOOGL is moving towards a line of 247.2200 which it has tested numerous times in the past. We…


