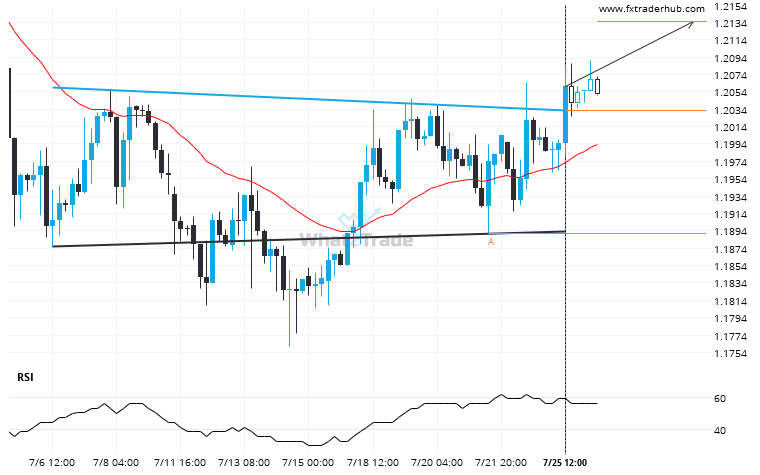
GBP/USD has broken through a resistance line. It has touched this line at least twice in the last 20 days. This breakout may indicate a potential move to 1.2135 within the next 4 days. Because we have seen it retrace from this position in the past, one should wait for confirmation of the breakout before trading.
GBP/USD has broken through resistance of a Inverse Head and Shoulders. It has touched this line at least twice in the last 20 days.