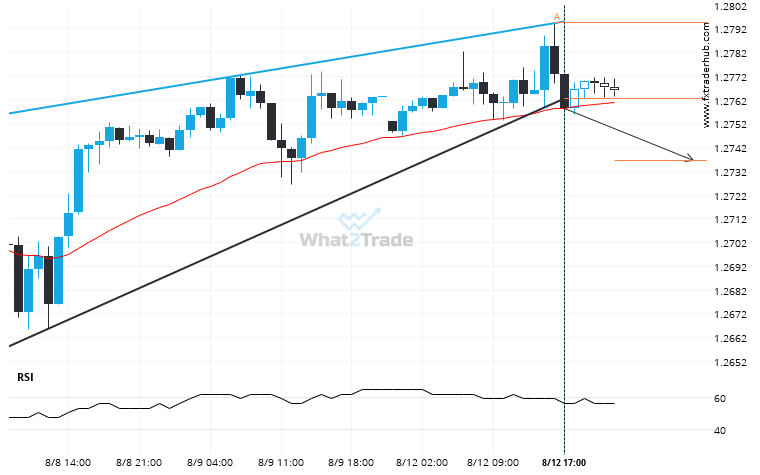
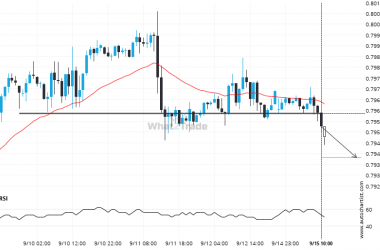
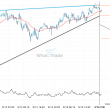
GBP/USD has broken through a support line of a Rising Wedge chart pattern. If this breakout holds true, we may see the price of GBP/USD testing 1.2736 within the next 11 hours. But don’t be so quick to trade, it has tested this line in the past, so you should confirm the breakout before taking any action.
Related Posts
USD/CAD is approaching 1.3595. We expect either a breakout through this line, or a rebound.
USD/CAD is moving towards a line of 1.3595 which it has tested numerous times in the past. We…
After trying numerous times in the past, USD/JPY finally breaks 143.1110!
USD/JPY has broken through a support line. Because we have seen it retrace from this price in the…
AUD/USD is quickly approaching a very important level it has previously tested numerous times in the past
The price of AUD/USD in heading back to the resistance area. It is possible that it will struggle…