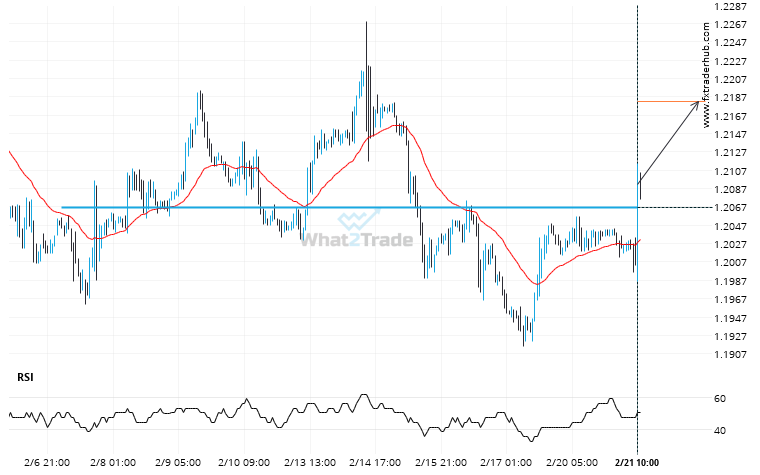
GBP/USD has broken through a resistance line. Because we have seen it retrace from this price in the past, one should wait for confirmation of the breakout before trading. It has touched this line numerous times in the last 15 days and suggests a possible target level to be around 1.2182 within the next 3 days.
Related Posts
Extreme movement experienced on AUDJPY. Check this chart to see what to do next
AUDJPY has moved lower by 1.26% from 95.5745 to 94.3655 in the last 2 days.
Interesting opportunity on EURCHF after breaking 0.9389486923076923
EURCHF has broken through a resistance line. It has touched this line at least twice in the last…
Rare set of bullish consecutive candles on the GBPCHF Daily chart. Can we expect a turn-around?
GBPCHF has moved higher after 5 consecutive daily candles from 1.0954 to 1.1169 in the last 7 days.